[Preprint]. 2024 Dec 20:2024.12.20.629544.
doi: 10.1101/2024.12.20.629544.

Three-dimensional regulatory hubs support oncogenic programs in glioblastoma

Affiliations

Three-dimensional regulatory hubs support oncogenic programs in glioblastoma

Sarah L Breves et al. bioRxiv. .

Update in

  • Three-dimensional regulatory hubs support oncogenic programs in glioblastoma.
    Breves SL, Di Giammartino DC, Nicholson J, Cirigliano S, Mahmood SR, Lee UJ, Martinez-Fundichely A, Jungverdorben J, Singhania R, Rajkumar S, Kirou R, Studer L, Khurana E, Polyzos A, Fine HA, Apostolou E. Breves SL, et al. Mol Cell. 2025 Apr 3;85(7):1330-1348.e6. doi: 10.1016/j.molcel.2025.03.007. Epub 2025 Mar 26. Mol Cell. 2025. PMID: 40147440

Abstract

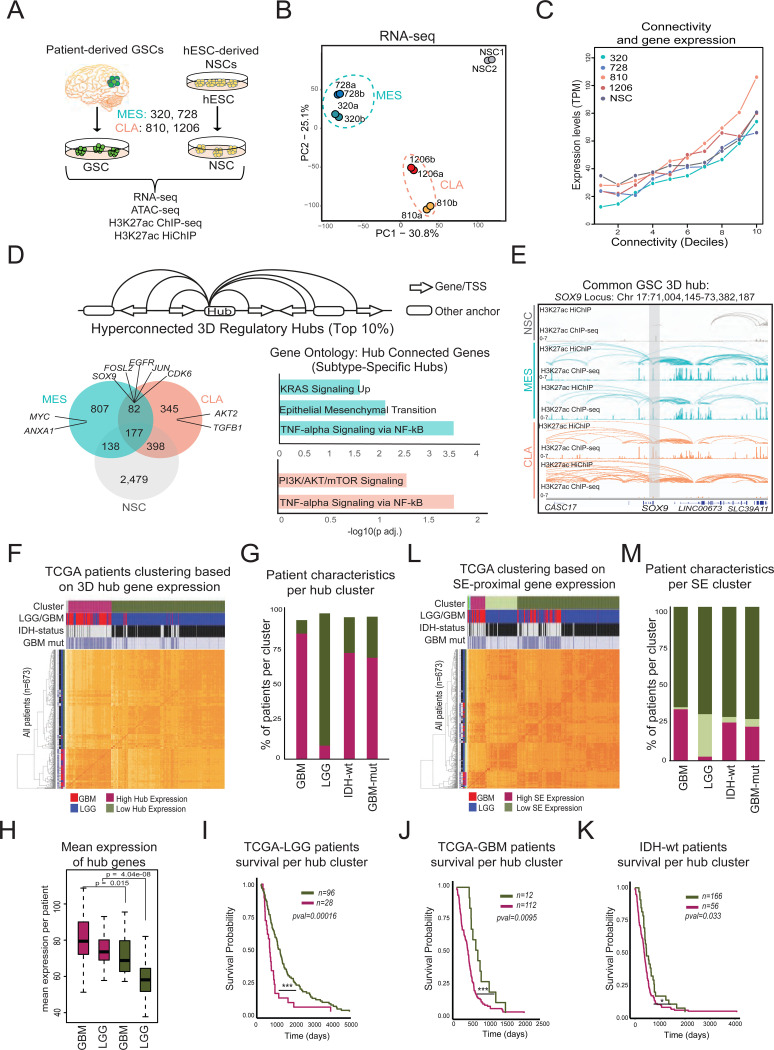
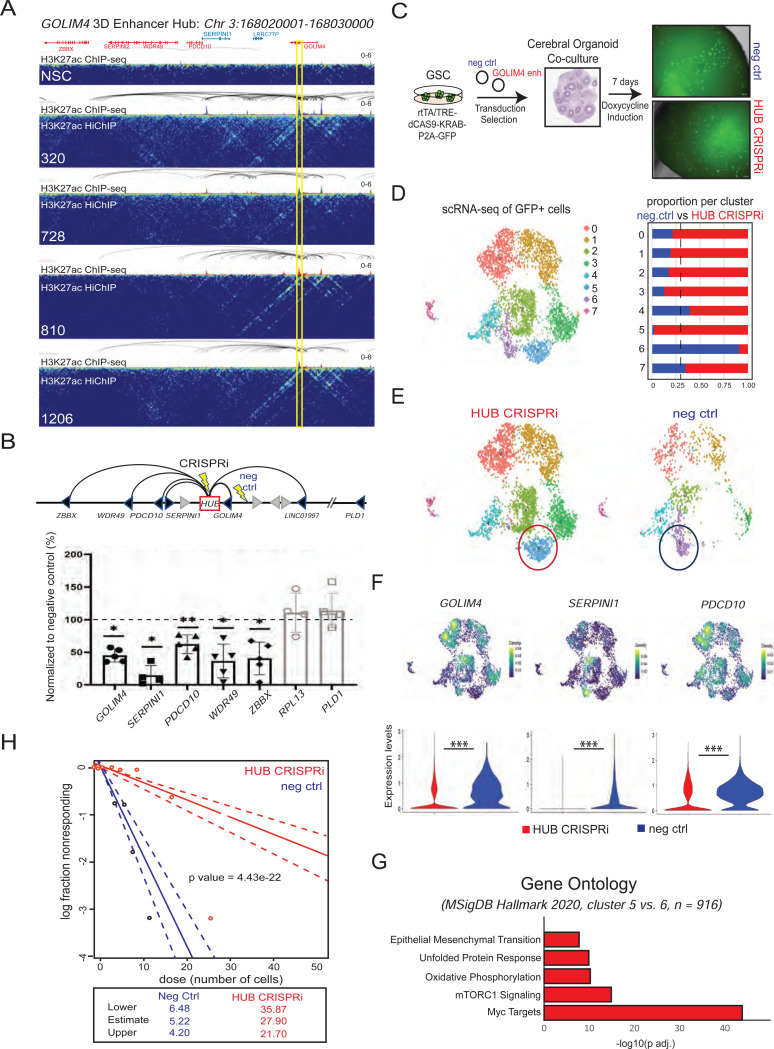
Dysregulation of enhancer-promoter communication in the context of the three-dimensional (3D) nucleus is increasingly recognized as a potential driver of oncogenic programs. Here, we profiled the 3D enhancer-promoter networks of primary patient-derived glioblastoma stem cells (GSCs) in comparison with neuronal stem cells (NSCs) to identify potential central nodes and vulnerabilities in the regulatory logic of this devastating cancer. Specifically, we focused on hyperconnected 3D regulatory hubs and demonstrated that hub-interacting genes exhibit high and coordinated expression at the single-cell level and strong association with oncogenic programs that distinguish IDH-wt glioblastoma patients from low-grade glioma. Epigenetic silencing of a recurrent 3D enhancer hub-with an uncharacterized role in glioblastoma-was sufficient to cause concordant downregulation of multiple hub-connected genes along with significant shifts in transcriptional states and reduced clonogenicity. By integrating published datasets from other cancer types, we also identified both universal and cancer type-specific 3D regulatory hubs which enrich for varying oncogenic programs and nominate specific factors associated with worse outcomes. Genetic alterations, such as focal duplications, could explain only a small fraction of the detected hyperconnected hubs and their increased activity. Overall, our study provides computational and experimental support for the potential central role of 3D regulatory hubs in controlling oncogenic programs and properties.

Keywords: 3D chromatin organization; CRISPRi; HiChIP; clonogenicity; enhancer hubs; enhancer-promoter interactions; glioblastoma; oncogenic program; single-cell RNA-seq; structural variants.


Conflict of interest statement

Conflict of interest statement The authors declare that the above study was conducted in the absence of any commercial, financial, or personal relationships that could have appeared to influence the work reported in this article. All authors have approved the submitted version.

Figures

Figure 1.
Figure 1.. Genes within hyperconnected 3D hubs associate with oncogenic programs, GBM biology and worse patient survival
(A) Schematic illustration of our experimental strategy, including GBM patient-derived sample IDs, molecular subtypes, strategy for NSC generation and list of datasets collected for this study (MES = mesenchymal subtype, CLA = classical subtype). (B) Principal Component Analysis (PCA) of all replicates based on their RNA-seq profiles. Only the top 10% most variable genes across samples were considered. (C) Plot showing the median normalized RNA-seq levels (expressed in transcripts per million, TPM) of genes with different degrees of H3K27ac HiChIP connectivity across samples. 10kb anchors were ranked based on their connectivity in deciles from lower to highest (1 to 10) and the median expression of all genes associated with each decile are displayed (D) Top: Schematic of 3D regulatory hub definition, Left: Venn diagram displaying numbers of 3D hyperconnected hubs (top 10% by number of connections) that are either unique for each molecular subtype (common between GSC samples of the same subtype) or shared across all GSC samples or NSCs. Right: Gene Ontology (EnrichR, Molecular Signature Database Hallmark 2020) of interacting genes within MES-specific (teal color) or CLA-specific (peach color) hubs. (E) IGV example of common GSC 3D regulatory hub (highlighted in gray) SOX9 along with the H3K27ac ChIP-seq signals and the H3K27ac HiChIP arcs for each sample. (F) Heatmap depicting hierarchical clustering of a TCGA brain tumor patient cohort (n=673) based on the expression of common GSC hubs connected genes (from panel (D)). The different colored bars at the top indicate (top) the different clusters (purple: high hub expression vs green: low-hub expression), (second) the original TCGA classification of the patients into GBM (red) and Low-Grade Glioma (LGG, blue), (third) the patients status as IDH-wt (black) or IDH-mutant (grey) and (bottom) the absence (light color) or presence (dark color) of at least one GBM mutant variant (TERT mutation, EGFR amplification/mutation, Trisomy 7 (partial or full)/deletion of chromosome 10, CDKN2A deletion) is also shown. (G) Bar plot depicting the percentages of GBM, LGG, IDH-wt, and GBM mutant patients within each 3D hub gene expression cluster from (F). (H) Boxplots showing the distribution and median expression of 3D hub genes per cluster split by tumor type (as originally assigned by TCGA). (I-K) Kaplan-Meier survival curves of (I) LGG patients (as originally classified by TCGA) or (J) GBM patients (as originally classified by TCGA) or (K) TCGA IDH-wt patients, each time clustered based on their expression of 3D hyperconnected GSC hub genes. Patients were split into quartiles based on their mean expression of hub-connected genes, and only patients with known survival outcomes were included. The numbers of patients in each cluster are shown on the top. P values from log-rank test are reported. (L) Heatmap depicting hierarchical clustering of expression of super-enhancer linear proximal genes (within 10kb) of TCGA cohort of GBM (red) and Low Grade Glioma (LGG, blue) patients. (M) Bar plot depicting the percentages of GBM, LGG, IDH-wt, and GBM mutant patients within each SE-cluster from (L).
Figure 2.
Figure 2.. 3D hubs in GBM coordinate and expand known oncogenic transcriptional programs.
(A) Heatmap displaying the relative connectivity (z-score) of (proto)oncogene-interacting hubs across samples from this study and two additional GSC/GBM 3D datasets. (B) IGV track depicting H3K27ac HiChIP arcs of a 3D enhancer hub (outlined in red) interacting with JUN and other genes across multiple GSC samples. (C) Top: Schematic showing all gene promoters that are connected to the JUN hub (shown in (B)) and the location (denoted by lightening bolt) of the guide RNAs used for CRIPSRi targeting of the JUN enhancer hub. Bottom: Relative mRNA levels of all JUN-connected genes upon CRISPRi silencing of JUN hub (48h) expressed relative (percentage) to the negative control values. Dots indicate independent replicates and experiments (n=3). Error bars indicate mean+/−standard deviation (s.d.). Asterisks indicate significance (*<0.05, **<0.005) as calculated by Student t-test. (D) Boxplots showing the distribution and median Spearman correlation values (rho) for gene-gene pairs connected to the same hub (in hub) compared to random, non-hub pairs with matched linear distances (Random) per sample. P-values were calculated by Wilcoxon rank test. (E) Ranking of 3D hubs in GSC#1206 based on the mean spearman correlation scores of all hub-connected gene pairs per hub. The red dashed line indicates the inflection point of the curve. Oncogenes according to the COSMIC cancer gene census are annotated. Red circles highlight the TCF3 hub (highly coregulated) and the JUND hubs (low coregulation score) which are shown in (G). (F) Left: Scatterplots of the scRNAseq counts and the respective Spearman correlation scores between each pair of hub-connected genes (black) and non-hub connected/skipped genes (gray) in a highly coregulated hub (by mean spearman correlation rho) in GSC #320. Right: UMAP of GSC#320 with kernel density estimator projection of corresponding individual hub genes (black) and skipped genes (gray) from left scatterplots. (G) UMAP of GSC#1206 scRNA-seq data with kernel density estimator projection of individual hub-connected genes of the (left) highly coregulated TCF3 hub or (right) the low-coregulated JUND hub according to the stratification shown in panel (E).
Figure 3.
Figure 3.. Targeting of a recurrent 3D hub with unknown role in glioblastoma causes transcriptional shifts and reduced clonogenicity.
(A) HiGlass visualization of the GOLIM4 3D enhancer hub (highlighted in yellow) showing the H3K27ac HiChIP contact matrices along with the respective HiChIP arcs and the H3K27ac ChIP-seq peaks for all GSC and NSC samples. Of note, this region is not active nor connected in NSCs. (B) Top: Schematic showing all gene promoters that are connected to the GOLIM4 hub and the location (denoted by lightening bolt) of the guide RNAs used for CRIPSRi targeting either the GOLIM4 enhancer hub (HUB CRISPRi) or a nearby, intergenic negative control region (neg ctrl). Bottom: Relative mRNA levels of all GOLIM4-connected genes (black) or non-hub control genes (grey) upon CRISPRi silencing of GOLIM4 hub (48h) expressed as percentage relative to the negative control values. Dots indicate independent replicates and experiments (n=5). Error bars indicate mean+/−standard deviation (s.d.). Asterisks indicate significance (*<0.05, **<0.005) as calculated by Student t-test. (C) Schematic of the cerebral organoid glioma model system (GLICO) where hESC-derived cerebral organoid are co-cultured with our CRISPRi targeted GSC cells in the presence of doxycycline (for dCas9-KRAB expression) for seven days prior to imaging and FACS of GFP+ cells for scRNA-seq analysis. (D) Left: Combined UMAP and clustering of all HUB CRISPRi and negative control GFP+ sorted cells following the experimental strategy shown in C. Right: Bar graph showing the percentage of cells representing each cluster per condition. CRISPRi cells in red, neg ctrl in blue. Dashed line represents expected proportion of neg ctrl samples per cluster if evenly distributed between clusters. (E) UMAPs with clustering displaying scRNA-seq data of either HUB CRISPRi cells (left) or neg ctrl cells (right). The two most differential clusters (5 and 6) are highlighted in circles. (F) Top: UMAP with projections of kernel density estimators of expression of GOLIM4 hub-connected genes. Bottom: Violin plots comparing the distribution of scRNA-seq levels of each hub-connected gene between the HUB CRIPSRi sample and the negative control. Asterisks indicate significance (pvalue<0.001) based on Wilcoxon test. (G) Gene ontology analysis (EnrichR, Molecular Signature Database Hallmark 2020) for genes scored as significantly perturbed (p adj. < 0.05) upon GOLIM4 hub silencing. The comparison focused on differentially expressed genes between clusters 5 and 6. (H) Extreme limited dilution assays comparing HUB CRISPRi GSCs with negative control GSC after 12 days in doxycycline (n= 24 replicates per dilution per condition, n=5 independent experiments). P value was calculated based on the difference between groups as calculated for the binomial generalized linear model fit for each condition.
Figure 4.
Figure 4.. 3D hubs across cancer types enrich for cancer-specific and universal oncogenic programs and only partly associate with structural variants
(A) Heatmap depicting k-means clustering of all hyperconnected 3D regulatory hubs based on their scaled and normalized connectivity values across samples and cancer types. BC: Breast Cancer, EC: Endometrial Carcinoma, ES: Ewin Sarcoma, M: Melanoma, GSC: Glioblastoma, SCLC: Small Cell Lung Carcinoma and HCC: Hepatocellular Carcinoma. (B) Gene Ontology (EnrichR, Molecular Signature Database Hallmark 2020) of all hub-connected genes per cancer type for each respective cluster. OR: Odds Ratio observed vs expected. (C) Example of the multi-cancer MYC promoter hub showing high heterogeneity of interactions (shown as HiChIP arcs) across samples. (D) Kaplan-Meier survival curves showing that TCGA melanoma and endometrial carcinoma patients with high mean expression of genes connected to the respective M- or ES- hub clusters as defined in (A) have significantly worse outcomes. Patients with very high/low expression were derived using the 1st and 4th quartiles, respectively. P values from logrank test are reported. (E) Normalized H3K27ac HiChIP contact matrices for the EGFR locus across GSC samples with EagleC detected SVs denoted by dashed circles. The ChIP Input of each sample is displayed below their respective sample matrix. (F) Bar graph displaying numbers and percentages of 3D hyperconnected hubs that overlap with EagleC predicted SV in each sample. Overlapping SV predictions were merged and counted as one. (G) Dot plot showing the results of ChIP Enrichment Analysis (ChEA by EnrichR) for select protein factors that are significantly enriched on hub-connected genes specific for each k-means cluster as defined in (A). OR: Odds Ratio observed vs expected. (H) Kaplan-Meier survival curves showing association of ChEA-nominated factors RUNX2 (left) or FOXA1 (right) expression levels with survival outcomes of TCGA GBM patients (IDH-wt only). Patients with very high/low expression were derived using 1st and 4th quartiles. p values from logrank test are reported.

References

    1. Brennan C.W., Verhaak R.G., McKenna A., Campos B., Noushmehr H., Salama S.R., Zheng S., Chakravarty D., Sanborn J.Z., Berman S.H., et al. (2013). The somatic genomic landscape of glioblastoma. Cell 155, 462–477. 10.1016/j.cell.2013.09.034. - DOI - PMC - PubMed
    1. Stupp R., Mason W.P., van den Bent M.J., Weller M., Fisher B., Taphoorn M.J., Belanger K., Brandes A.A., Marosi C., Bogdahn U., et al. (2005). Radiotherapy plus concomitant and adjuvant temozolomide for glioblastoma. N Engl J Med 352, 987–996. 10.1056/NEJMoa043330. - DOI - PubMed
    1. Tan A.C., Ashley D.M., López G.Y., Malinzak M., Friedman H.S., and Khasraw M. (2020). Management of glioblastoma: State of the art and future directions. CA Cancer J Clin 70, 299–312. 10.3322/caac.21613. - DOI - PubMed
    1. White K., Connor K., Clerkin J., Murphy B.M., Salvucci M., O’Farrell A.C., Rehm M., O’Brien D., Prehn J.H.M., Niclou S.P., et al. (2020). New hints towards a precision medicine strategy for IDH wild-type glioblastoma. Ann Oncol 31, 1679–1692. 10.1016/j.annonc.2020.08.2336. - DOI - PubMed
    1. Neftel C., Laffy J., Filbin M.G., Hara T., Shore M.E., Rahme G.J., Richman A.R., Silverbush D., Shaw M.L., Hebert C.M., et al. (2019). An Integrative Model of Cellular States, Plasticity, and Genetics for Glioblastoma. Cell 178, 835–849 e821. 10.1016/j.cell.2019.06.024. - DOI - PMC - PubMed

Publication types

LinkOut - more resources