. 2025 Jan 30;28(3):111932.
doi: 10.1016/j.isci.2025.111932. eCollection 2025 Mar 21.

Predicting tuberculosis drug efficacy in preclinical and clinical models from in vitro data

Affiliations

Predicting tuberculosis drug efficacy in preclinical and clinical models from in vitro data

Janice J N Goh et al. iScience. .

Abstract

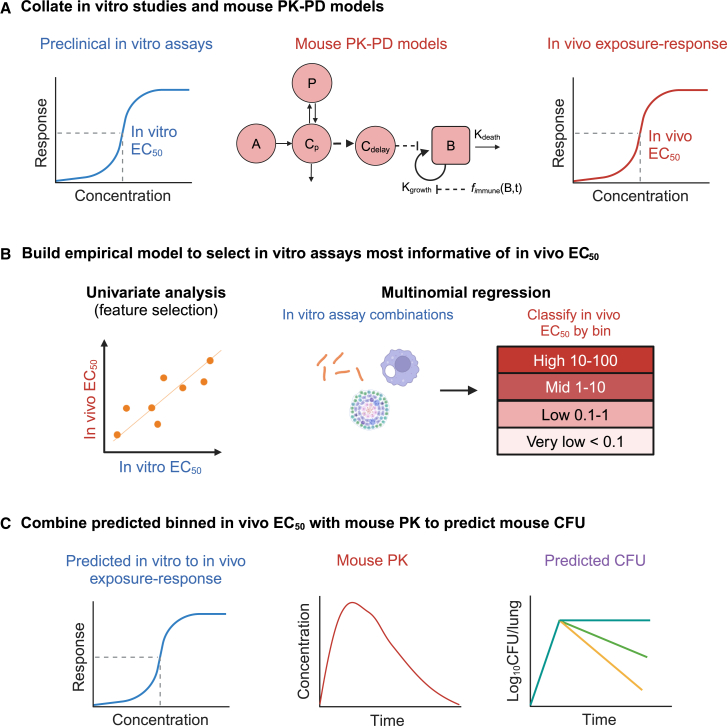
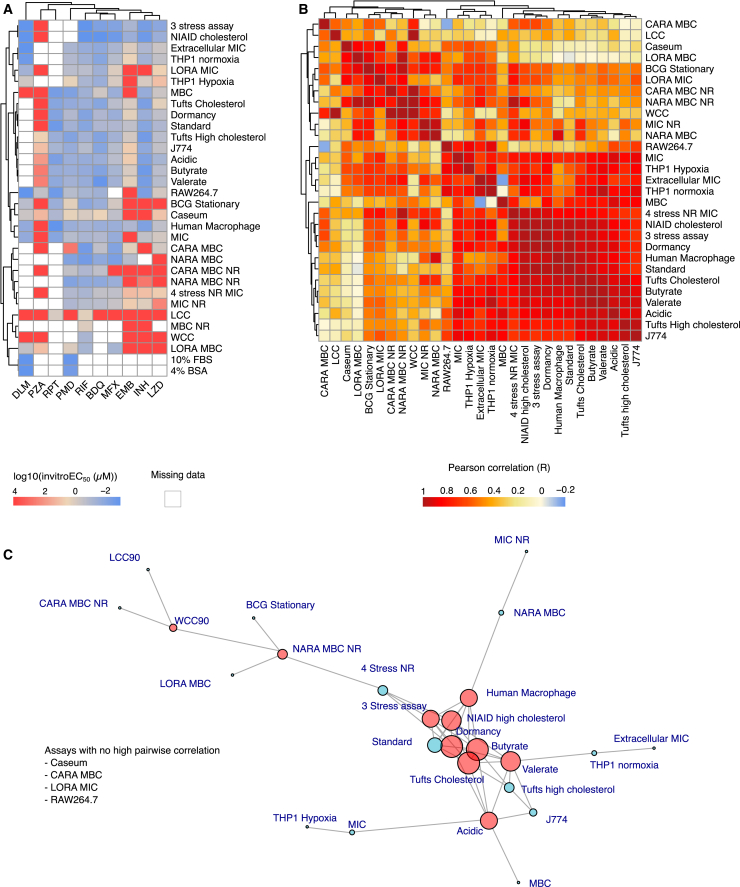
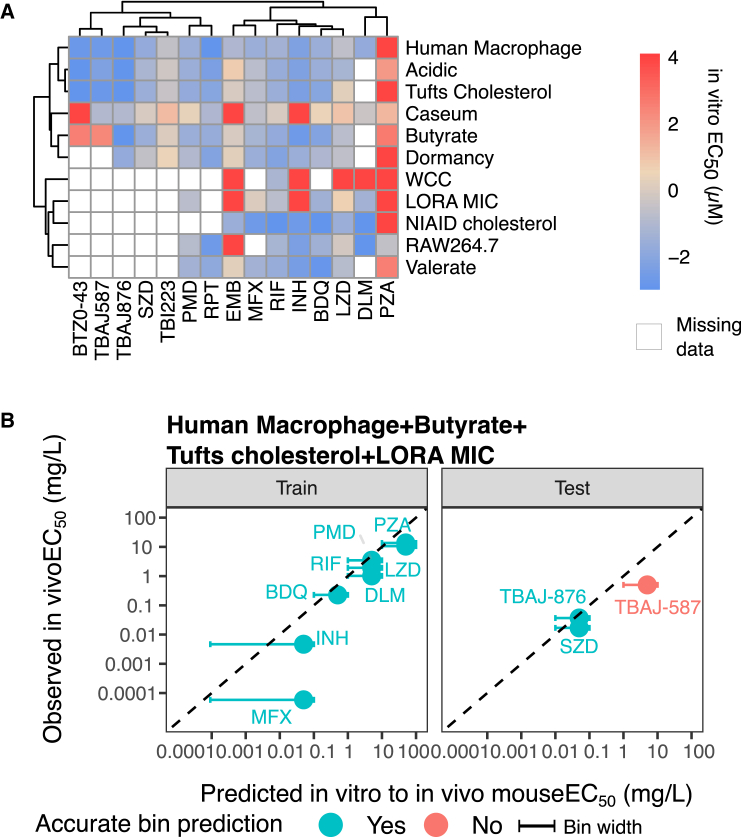
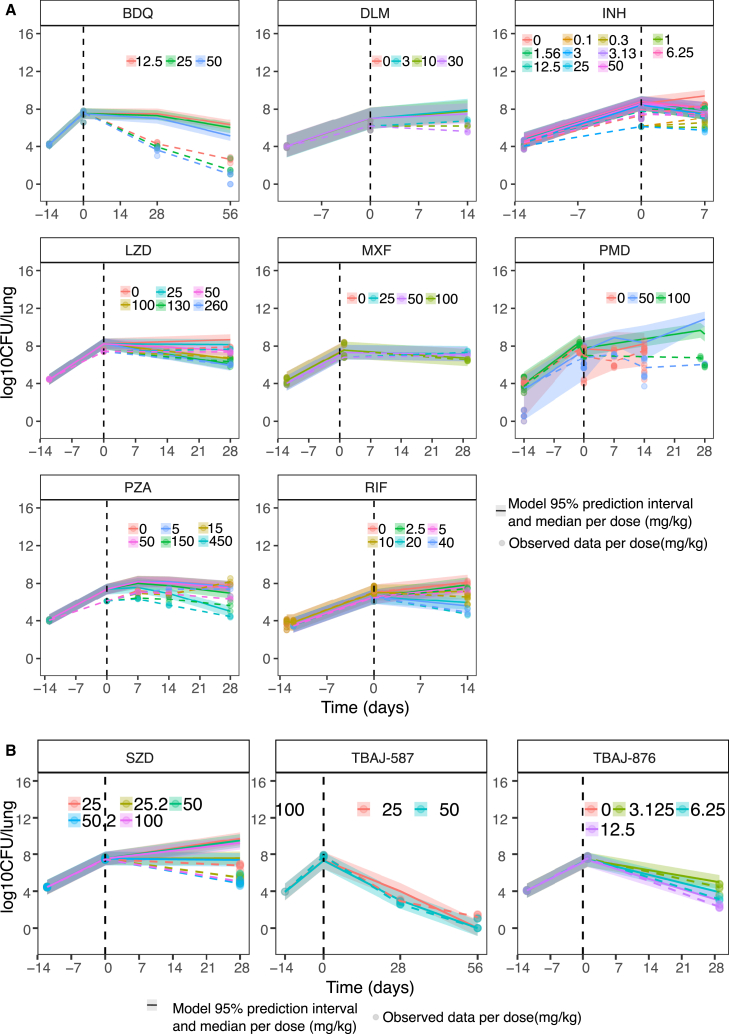
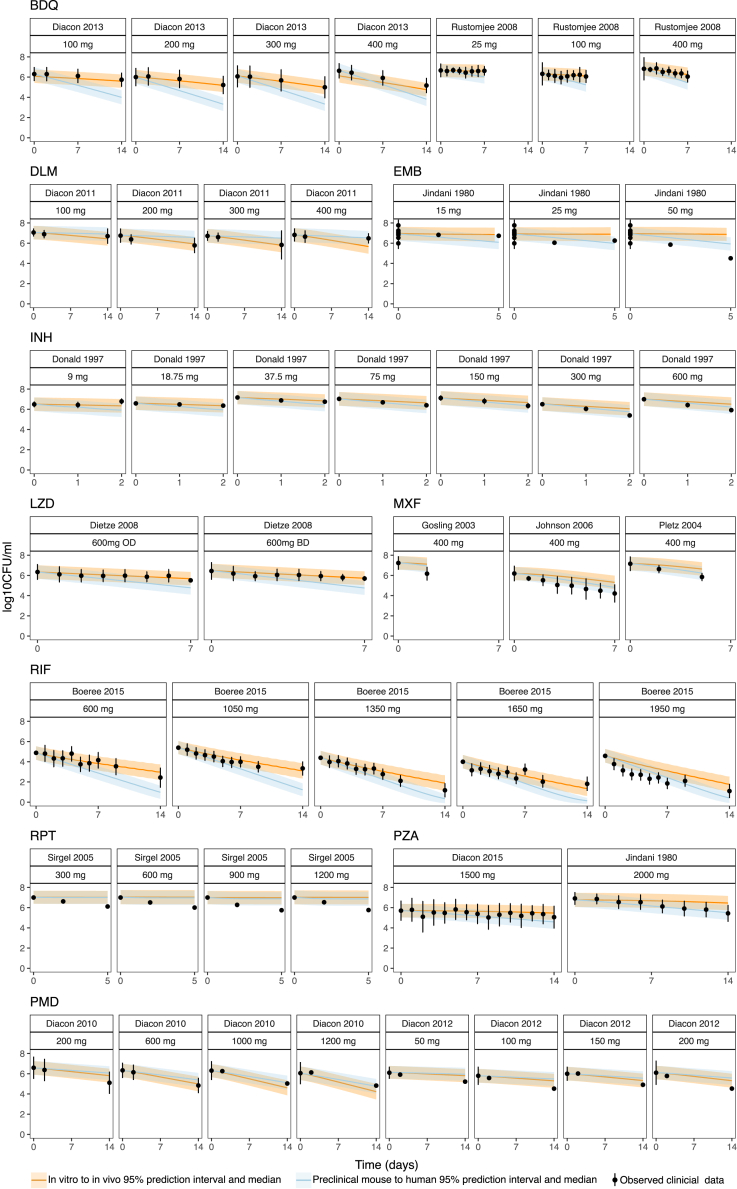
Multiple in vitro potency assays are used to evaluate compounds against Mycobacterium tuberculosis, but a consensus on clinically relevant assays is lacking. We aimed to identify an in vitro assay signature that predicts preclinical efficacy and early clinical outcome. Thirty-one unique in vitro assays were compiled for 10 TB drugs. In vitro EC50 values were compared to pharmacokinetic-pharmacodynamic (PK-PD)-model-derived EC50 values from mice evaluated via multinomial regression. External validation of best-performing in vitro assay combinations was performed using five new TB drugs. Best-performing assay signatures for acute and subacute infections were described by assays that reproduce conditions found in macrophages and foamy macrophages and chronic infection by the ex vivo caseum assay. Subsequent simulated mouse bacterial burden over time using predicted in vivo EC50 was within 2-fold of observations. This study helps us identify clinically relevant assays and prioritize successful drug candidates, saving resources and accelerating clinical success.

Keywords: bioinformatics; biological sciences; natural sciences; pharmacoinformatics; pharmacology.


Conflict of interest statement

The authors declare no conflicts of interest.

Figures

Figure 1
Figure 1
A three-step pipeline to translate in vitro potency (EC50) to in vivo mouse EC50 and in vivo efficacy when combined with a pharmacokinetic-pharmacodynamic (PK-PD) model (A) In vitro assays were collected from literature and from collaborators for 10 drugs of interest: bedaquiline (BDQ), delamanid (DLM), ethambutol (EMB), isoniazid (INH), linezolid (LZD), moxifloxacin (MXF), pretomanid (PMD), pyrazinamide (PZA), rifampicin (RIF), and rifapentine (RPT). Mouse PK-PD models with a baseline describing bacterial dynamics were also previously built for these drugs. (B) Univariate linear regression was first carried out to understand the individual relationships between in vitro EC50 and in vivo EC50 derived from mouse PK-PD models. A multinomial regression was then built to find the least number of in vitro assays with the best accuracy for predicting in vivo EC50. (C) Predicted in vivo EC50 was used to make a new exposure-response relationship in the mouse PK-PD model to predict the bacterial colony-forming units (CFUs) over time profile in mouse.
Figure 2
Figure 2
In vitro assay description and correlation (A) Overview of all 31 in vitro assays across 10 drugs of interest, clustered by their in vitro potency (EC50). Missing data were denoted as an empty white square, whereas inactive drugs in an assay were arbitrarily assigned a value of 9999. (B) Pairwise correlations between in vitro assays clustered by their Pearson correlation value (R) show many high positive correlations between in vitro assays. (C) Network plot of high pairwise correlations between in vitro assays. In vitro assays with absolute pairwise correlations higher than 0.9 were joined by an edge in the network plot. Assays with six or more edges, or with the greatest number of edges in their cluster, filled in red, were chosen as representative of the many highly correlated assays. Table 2 also lists every significant pairwise correlation among the assays with high correlation. Assays that had no high pairwise correlations were also selected as features for further analysis. BDQ, bedaquiline, DLM, delamanid, EMB, ethambutol, INH, isoniazid, LZD, linezolid, MXF, moxifloxacin, PMD, pretomanid, PZA, pyrazinamide, RIF, rifampicin, and RPT, rifapentine.
Figure 3
Figure 3
Feature perturbation identifies the best-performing combination of in vitro assays (A) Feature perturbation was carried out to find the minimum number of features that could reliably classify in vivo mouse EC50 from in vitro potencies. All possible combinations of 1–5 in vitro assays were carried out. (B) Test result of leave-one-out cross-validation performance in the training set with best-performing in vitro assay combinations. The lowest bin of <0.1 mg/L has an extended bin width to indicate that any drug with predicted EC50 < 0.1 mg/L will fall into that bin. BDQ, bedaquiline (BDQ), delamanid (DLM), ethambutol (EMB), isoniazid (INH), linezolid (LZD), moxifloxacin (MXF), pretomanid (PMD), pyrazinamide (PZA), rifampicin (RIF), and rifapentine (RPT).
Figure 4
Figure 4
External validation of the model with TB drug candidates (A) Data availability of in vitro assays with five new TB drugs. (B) Model performance across different in vitro assay combinations shows that some assay combinations are more generalizable to new drugs. Error bars represent the bin width of the predicted bin, and points align with the observed in vivo EC50 on the y axis and middle of the predicted bin on the x axis. The lowest bin of <0.1 mg/L has an extended bin width to indicate that any drug with predicted EC50 < 0.1 mg/L will fall into that bin. The training set consisted of the 10 drugs used to train the models, whereas the testing set consisted of new drugs used to validate the models. BDQ, bedaquiline, DLM, delamanid, EMB, ethambutol, INH, isoniazid, LZD, linezolid, MXF, moxifloxacin, PMD, pretomanid, PZA, pyrazinamide, RIF, rifampicin, RPT, rifapentine, and SZD, sutezolid.
Figure 5
Figure 5
Simulations versus observed mouse data using predicted mouse EC50 Five hundred simulations per drug per mouse infection model were run. Ribbons represent the 95% prediction interval and solid lines the median model prediction. Dotted lines are the median of observed values. Observed data are represented as points. (A) Simulations with the initial eight drugs used for feature selection and model development. (B) Simulations with three new drugs used as external validation demonstrate the extent to which our model was generalizable. The in vitro to in vivo EC50 prediction models selected for this simulation of mouse CFU are as listed in Table S1. Model performance across all mouse infection models is in Figure S5. BDQ, bedaquiline, DLM, delamanid, EMB, ethambutol, INH, isoniazid, LZD, linezolid, MXF, moxifloxacin, PMD, pretomanid, PZA, pyrazinamide, RIF, rifampicin, RPT, rifapentine, and SZD, sutezolid.
Figure 6
Figure 6
Prediction of early bactericidal activity outcomes in clinical populations Simulations using clinical PK with the predicted exposure-response relationship show good fits with observed clinical trial data for the 10 training set drugs. Subacute model predictions were used for all models except for EMB, which used an acute model and RPT, which used a chronic model. BDQ, bedaquiline, DLM, delamanid, EMB, ethambutol, INH, isoniazid, LZD, linezolid, MXF, moxifloxacin, PMD, pretomanid, PZA, pyrazinamide, RIF, rifampicin, RPT, rifapentine. Observations are represented as mean +/− standard deviation, and simulations are represented as mean with 95% confidence intervals.

References

    1. Global Tuberculosis Report. 2022. https://www.who.int/teams/global-tuberculosis-programme/tb-reports/globa...
    1. Nahid P., Dorman S.E., Alipanah N., Barry P.M., Brozek J.L., Cattamanchi A., Chaisson L.H., Chaisson R.E., Daley C.L., Grzemska M., et al. Executive Summary: Official American Thoracic Society/Centers for Disease Control and Prevention/Infectious Diseases Society of America Clinical Practice Guidelines: Treatment of Drug-Susceptible Tuberculosis. Clin. Infect. Dis. 2016;63:853–867. - PMC - PubMed
    1. Vernon A., Fielding K., Savic R., Dodd L., Nahid P. The importance of adherence in tuberculosis treatment clinical trials and its relevance in explanatory and pragmatic trials. PLoS Med. 2019;16 - PMC - PubMed
    1. Dartois V.A., Rubin E.J. Anti-tuberculosis treatment strategies and drug development: challenges and priorities. Nat. Rev. Microbiol. 2022;20:685–701. - PMC - PubMed
    1. Franzblau S.G., Witzig R.S., McLaughlin J.C., Torres P., Madico G., Hernandez A., Degnan M.T., Cook M.B., Quenzer V.K., Ferguson R.M., Gilman R.H. Rapid, low-technology MIC determination with clinical Mycobacterium tuberculosis isolates by using the microplate Alamar Blue assay. J. Clin. Microbiol. 1998;36:362–366. - PMC - PubMed