. 2025 Apr;16(2):e13763.
doi: 10.1002/jcsm.13763.

Deubiquitinating Enzymes Regulate Skeletal Muscle Mitochondrial Quality Control and Insulin Sensitivity in Patients With Type 2 Diabetes

Affiliations

Deubiquitinating Enzymes Regulate Skeletal Muscle Mitochondrial Quality Control and Insulin Sensitivity in Patients With Type 2 Diabetes

Wagner S Dantas et al. J Cachexia Sarcopenia Muscle. 2025 Apr.

Abstract

Background: Activation of mitochondrial fission and quality control occur early in the onset of insulin resistance in human skeletal muscle. We hypothesized that differences in mitochondrial dynamics, structure and bioenergetics in humans would explain the onset and progression of type 2 diabetes (T2D).

Methods: Fifty-eight sedentary adults (37 ± 12 years) were enrolled into one of three groups: (1) healthy weight (HW), (2) overweight and obesity (Ow/Ob), or (3) T2D. Body composition, aerobic capacity, and insulin sensitivity were assessed during a 3-day inpatient stay. A fasted skeletal muscle biopsy was obtained to assess mitochondrial functions. C2C12 myoblasts were transfected with FLAG-HA-USP15 and FLAG-HA-USP30 and harvested to assess mitochondrial dynamics and cellular insulin action.

Results: Insulin sensitivity and aerobic capacity were lower in Ow/Ob (132% and 28%, respectively) and T2D (1024% and 83%, respectively) relative to HW. Patients with T2D presented with elevated skeletal muscle mitochondrial fission (3.2 fold relative to HW and Ow/Ob), decreased fusion, and impairments in quality control. Mitochondrial content was lower in Ow/Ob (26%) and T2D (56%). USP13 (84%), USP15 (96%) and USP30 (53%) expression were increased with decreased Parkin and Ub activation in T2D alone. USP15 (R2 = 0.55, p < 0.0001) and USP30 (R2 = 0.40, p < 0.0001) expression negatively correlated with peripheral insulin sensitivity. USP15 and USP30 overexpression activated DRP1 (3.6 and 3.7 fold, respectively) while inhibiting AKT (96% and 81%, respectively) and AS160 (2.1 and 3.5 fold, respectively) phosphorylation.

Conclusion: Mitochondrial fragmentation bypasses defects in mitophagy to sustain skeletal muscle quality control in patients with T2D.

Keywords: bioenergetics; fission; fusion; mitochondria; obesity; quality control; type 2 diabetes.


Conflict of interest statement

c.e.F. is currently an investigator at Mission Therapeutics, a company with commercial interest in deubiquinating enzymes (DUB) drug discovery and development. Mission Therapeutics had no role in the design and conduct of the study, collection, analysis or interpretation of the data, manuscript preparation or review.

Figures

FIGURE 1
FIGURE 1
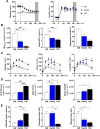
Glucose metabolism, insulin sensitivity and whole‐body substrate metabolism. (A) Fasting glucose and clamp‐derived euglycemia and fasting insulin and clamp‐derived hyperinsulinemia. (B) The ratio of glucose metabolized (M) relative to the prevailing insulin concentration (I) under steady state conditions of the clamp (M/I index), basal hepatic glucose production (HGP) and insulin‐suppressed hepatic glucose production (HGP). (C) Glucose, insulin and C‐peptide concentrations during the oral glucose tolerance test (OGTT). (D) Total area under the curve (tAUC) of glucose, insulin and c‐peptide. (E) Homeostatic model assessment for insulin resistance (HOMA‐IR), disposition index and the Matsuda index. Healthy weight (HW), overweight/obesity (Ow/Ob) and overweight/obesity with type 2 diabetes (T2D). Data are shown as the mean ± SEM. * indicates p < 0.05; ** p < 0.01; *** p < 0.001; **** p < 0.0001 for between‐group comparison.
FIGURE 2
FIGURE 2
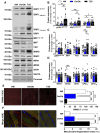
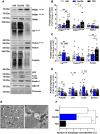
Expression of proteins regulating mitochondrial fission. (A–D) Representative and densitometric quantification immunoblots of phosphorylated and total DRP1, phosphorylated and total MFF, FIS1, Mid49, Mid51, MFN1, MFN2, OPA1 and HSC70 (loading control) relative to healthy weight group (n = 14 per group). (E, F). Representative confocal micrographs of resting mitochondrial membrane potential (150× magnification). Micrographs are shown as TMRM alone (E) or (F) merge of TMRM, MitoTracker deep red and Hoechst (63× magnification). (E) Quantification of loss of mitochondrial membrane potential and (F) mitochondrial fragmentation. Healthy weight (HW), overweight/obesity (Ow/Ob) and overweight/obesity with type 2 diabetes (T2D). Data are shown as the mean ± SEM. * indicates p < 0.05; ** p < 0.01; *** p < 0.001; **** p < 0.0001 for between‐group comparison.
FIGURE 3
FIGURE 3
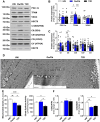
Expression of proteins regulating mitochondrial biogenesis and content. (A–C) Representative immunoblots and densitometric quantification of PGC‐1 α, TFAM, VDAC, respiratory mitochondrial complex I (CI), II (CII), III (CIII), IV, V and HSC70 (loading control) relative to healthy weight group (n = 14 per group). (D) Representative images of intermyofibrillar mitochondrial content from transmission electron micrographs (scale bars [black] = 2 μm) (n = 3 per group). (E) Quantification of mitochondrial density from the transmission electron micrographs and enzymatic activity of citrate synthase (CS) normalized to protein concentration (n = 14 per group). (F) The stoichiometric imbalance ratio between mitochondrial (COX2) and nuclear (ATP5a and SDH) encoded proteins from the respiratory mitochondrial complex. Healthy weight (HW), overweight/obesity (Ow/Ob) and overweight/obesity with type 2 diabetes (T2D). Data are shown as the mean ± SEM. * indicates p < 0.05; ** p < 0.01; *** p < 0.001; **** p < 0.0001 for between‐group comparison.
FIGURE 4
FIGURE 4
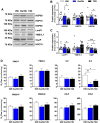
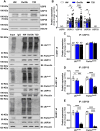
Expression of proteins regulating mitochondrial proteostasis and unfolded protein response and mitochondrial function. (A–C) Representative immunoblots and densitometric quantification of HSP60, HSP70, HSP90, LonP1, YME1L1, CLpP and HSC70 (loading control) relative to healthy weight group (n = 14 per group). (D) Assessment of NADH‐linked oxidative phosphorylation (OXPHOS) and electron transfer (ET) capacity, succinate‐linked OXPHOS and ET capacity, convergent NADH‐ and succinate‐linked OXPHOS and ET capacity, complex III OXPHOS and complex IV ET capacity in permeabilized skeletal muscle fibres (n = 12–20 per group). Healthy weight (HW), overweight/obesity (Ow/Ob) and overweight/obesity with type 2 diabetes (T2D). Data are shown as the mean ± SEM. * indicates p < 0.05; ** p < 0.01; *** p < 0.001; **** p < 0.0001 for between‐group comparison.
FIGURE 5
FIGURE 5
Expression of proteins regulating mitochondrial quality control. (A–D) Representative immunoblots and densitometric quantification of phosphorylated and total PINK1, ubiquitin phosphorylated, phosphorylated and total Parkin, total polyubiquination, p62, LC3II, Beclin1 and HSC70 (loading control) relative to healthy weight group (n = 14 per group). (E and F) Representative images and quantification of autophagosomes surrounding mitochondria from transmission electron micrographs (scale bars in black = 0.5 μm) (n = 3 per group). Healthy weight (HW), overweight/obesity (Ow/Ob) and overweight/obesity with type 2 diabetes (T2D). Data are shown as the mean ± SEM. * indicates p < 0.05; ** p < 0.01; *** p < 0.001; **** p < 0.0001 for between‐group comparison.
FIGURE 6
FIGURE 6
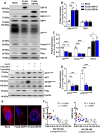
Expression of deubiquitinases and protein–protein interaction in skeletal muscle. (A and B) Representative immunoblots and densitometric quantification of USP8, USP13, USP15, USP30, USP33 and HSC70 (loading control) relative to healthy weight group (n = 14 per group). (C–E) Protein–protein interaction between USP13, USP 15 and USP30 with Parkin (n = 4 per group). Healthy weight (HW), overweight/obesity (Ow/Ob) and overweight/obesity with type 2 diabetes (T2D). Data are shown as the mean ± SEM. * indicates p < 0.05; ** p < 0.01; *** p < 0.001; **** p < 0.0001 for between‐group comparison.
FIGURE 7
FIGURE 7
Overexpression of deubiquitinases USP15/30 blunts Ub/Parkin phosphorylation and insulin sensitivity in C2C12 myoblasts. (A–C) Representative immunoblots and densitometric quantification of phosphorylated and total DRP1, ubiquitin phosphorylated, phosphorylated and total Parkin, FLAG and HSC70 (loading control) relative to empty vector (mock) (n = 4 biological replicates per group). (A and D) Representative immunoblots and densitometric quantification of phosphorylated and total Akt, phosphorylated and total AS160, FLAG and β‐actin (loading control) ± 30 min of insulin stimulation relative to vehicle (N = 4 biological replicates per group). (E) Representative confocal micrographs of C2C12 myoblasts stained with MitoTracker deep red and Hoechst (n = 3 biological replicates per group). (F) Relationship between skeletal muscle USP15 and USP30 expression and M/I150–180. Data are shown as the mean ± SEM. * indicates p < 0.05; ** p < 0.01; *** p < 0.001; **** p < 0.0001 for between‐group comparison.

References

    1. Ritov V. B., Menshikova E. V., He J., Ferrell R. E., Goodpaster B. H., and Kelley D. E., “Deficiency of Subsarcolemmal Mitochondria in Obesity and Type 2 Diabetes,” Diabetes 54 (2005): 8–14. - PubMed
    1. Simoneau J. A. and Kelley D. E., “Altered Glycolytic and Oxidative Capacities of Skeletal Muscle Contribute to Insulin Resistance in NIDDM,” Journal of Applied Physiology 83 (1985): 166–171. - PubMed
    1. Mogensen M., Sahlin K., Fernstrom M., et al., “Mitochondrial Respiration Is Decreased in Skeletal Muscle of Patients With Type 2 Diabetes,” Diabetes 56 (2007): 1592–1599. - PubMed
    1. Boushel R., Gnaiger E., Schjerling P., Skovbro M., Kraunsoe R., and Dela F., “Patients With Type 2 Diabetes Have Normal Mitochondrial Function in Skeletal Muscle,” Diabetologia 50 (2007): 790–796. - PMC - PubMed
    1. Turner N., Bruce C. R., Beale S. M., et al., “Excess Lipid Availability Increases Mitochondrial Fatty Acid Oxidative Capacity in Muscle: Evidence Against a Role for Reduced Fatty Acid Oxidation in Lipid‐Induced Insulin Resistance in Rodents,” Diabetes 56 (2007): 2085–2092. - PubMed