. 2025 Mar 3;66(3):5.
doi: 10.1167/iovs.66.3.5.

Butyrate Ameliorates Graves' Orbitopathy Through Regulating Orbital Fibroblast Phenotypes and Gut Microbiota

Affiliations

Butyrate Ameliorates Graves' Orbitopathy Through Regulating Orbital Fibroblast Phenotypes and Gut Microbiota

Pingbo Ouyang et al. Invest Ophthalmol Vis Sci. .

Abstract

Purpose: Graves' orbitopathy (GO), the common extrathyroidal complication of Graves' disease (GD), is characterized by orbital fibroblast stimulation, adipogenesis, and hyaluronan production. Recently, gut microbiota and its metabolites have garnered attention for their possible involvement in GO.

Methods: This study utilized an animal model of GO and examined the effects of butyrate treatment on orbital fibroblast cells and gut microbiota. Ex vivo experiments were performed using orbital fibroblasts derived from healthy patients' and patients' with GO orbital tissue to evaluate vitality, activation, and adipogenesis in response to butyrate treatment. Gut microbiota diversity was also analyzed in butyrate-treated and untreated GO mice.

Results: In human orbital fibroblasts, butyrate treatment dramatically decreased the vitality of GO-derived fibroblasts without harming normal fibroblasts. Butyrate prevented activation and fibrotic processes induced by transforming growth factor beta 1 (TGF-β1) in GO and normal fibroblasts. Additionally, butyrate reduced lipid droplet formation and downregulated lipogenic markers in GO and normal orbital fibroblasts, inhibiting adipogenesis. In the GO mouse model, butyrate therapy improved orbital histological abnormalities and normalized serum thyroid hormone and antibody levels. The intestinal microbiome of butyrate-treated GO mice also changed significantly, with a reduction in certain bacteria (Bifidobacterium, GCA-900066575, and Parabacteroides) and an increase in others (Bacteroides and Rikenellaceae_RC9).

Conclusions: Butyrate ameliorates several of the symptoms of GO, lowering GO orbital fibroblast viability, adipogenesis, and TGF-β1-induced fibrosis without damaging normal fibroblasts. Butyrate normalizes thyroid function in a GO mouse model, improves histopathological alterations, and transforms gut microbiota populations, proving its potential in treating GO through the gut-thyroid axis.


Conflict of interest statement

Disclosure: P. Ouyang, None; J. Qi, None; B. Tong, None; Y. Li, None; J. Cao, None; L. Wang, None; T. Niu, None; X. Qi, None

Figures

Figure 1.
Figure 1.
Effects of butyrate on orbital fibroblast cell viability. Orbital fibroblasts isolated from healthy donors’ or patients with Graves’ orbitopathy (GO) orbital tissues were treated with 0, 0.5, 1, 5, 10, 25, 50, and 100 µM butyrate for 24, 48, or 72 hours and examined for cell viability using a Cell Counting Kit-8 (CCK-8) assay kit (n = 3, **P < 0.01).
Figure 2.
Figure 2.
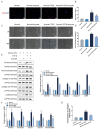
Effects of butyrate on GO orbital fibroblast activation . GO orbital fibroblasts were treated with butyrate (50 µM for 24 hours) and/or TGF-β1 (10 ng/mL, for 24 hours) and examined for cell proliferation using EdU assay (A, B); cell migration using scratch wound healing assay (C, D); the protein levels of vimentin, fibronectin, collagen I, collagen III, and α-SMA using immunoblotting (E); the mRNA expression of vimentin, fibronectin, collagen I, collagen III, and α-SMA using qRT-PCR (F); the concentration of collagen I using collagen I kit (G) (n = 3, **P < 0.01 vs. the GO group; ##P < 0.01 vs. the GO + TGFβ1 group).
Figure 3.
Figure 3.
Effects of butyrate on normal orbital fibroblast activation . Normal orbital fibroblasts were treated with butyrate (50 µM for 24 hours) and/or TGF-β1 (10 ng/mL, for 24 hours) and examined for cell proliferation using the EdU assay (A, B); cell migration using the scratch wound healing assay (C, D); the protein levels of vimentin, fibronectin, collagen I, collagen III, and α-SMA using immunoblotting (E); the mRNA expression of vimentin, fibronectin, collagen I, collagen III, and α-SMA using qRT-PCR (F); the concentration of collagen I using a collagen I ELISA kit (G) (n = 3, **P < 0.01 vs. the healthy group; ##P < 0.01 vs. the healthy + TGF-β1 group).
Figure 4.
Figure 4.
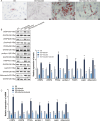
Effects of butyrate on GO orbital fibroblast adipogenesis . GO orbital fibroblasts were cultivated in standard or adipogenesis-inducing culture medium, with or without butyrate (10 µM), and examined for lipid droplet formation using Oil-Red O staining (induction for 10 days) (A); the protein levels of c/EBPα, c/EBPβ, PPARγ, perilipin-1, FABP4, leptin, and adiponectin using immunoblotting (B); the mRNA expression levels of c/EBPα, c/EBPβ, PPARγ, perilipin-1, FABP4, leptin, and adiponectin using qRT-PCR (C) (induction for 4 days, n = 3, **P < 0.01 vs. the GO group; ##P < 0.01 vs. the GO + induction group).
Figure 5.
Figure 5.
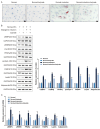
Effects of butyrate on healthy orbital fibroblast adipogenesis. Healthy orbital fibroblasts were cultivated in standard or adipogenesis-inducing culture medium, with or without butyrate (10 µM), and examined for lipid droplet formation using Oil-Red O staining (induction for 10 days) (A); the protein levels of c/EBPα, c/EBPβ, PPARγ, perilipin-1, FABP4, leptin, and adiponectin using immunoblotting (B); the mRNA expression levels of c/EBPα, c/EBPβ, PPARγ, perilipin-1, FABP4, leptin, and adiponectin using qRT-PCR (C) (induction for 4 days, n = 3, **P < 0.01 vs. the healthy group; ##P < 0.01 vs. the healthy + induction group).
Figure 6.
Figure 6.
Butyrate relieves orbital histopathological changes in the GO mice model. BALB/c mice were immunized with the Ad-TSHR for GO model establishment, with or without butyrate; at the end of modeling, the mice from different groups were examined for mice eye appearance (A); orbit and extraocular muscle (red arrows indicated) was observed using MRI scanning (B); histopathological alterations in orbital tissues were examined using H&E staining (C); histopathological alterations in orbital muscular tissues were examined using Masson staining (D); IHC staining of α-SMA and FABP4 levels (E); relative collagen and adipose tissue area were calculated according to histopathological evaluation (n = 6, **P < 0.01 vs. the control group; #P < 0.05, ##P < 0.01 vs. the GO group).
Figure 7.
Figure 7.
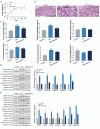
Butyrate ameliorates thyroid functions in the GO mice model. (A) Body weight of mice in each group was measured on weeks 0, 3, 6, 9, 12, and 15 of modeling. (B) Histopathological alterations in mice thyroid tissues were examined using H&E staining. (C) Serum levels of T4, TSAb, TSBAb, T3, FT4, and TSH in mice from different groups were determined using corresponding ELISA kits (n = 6). (D, E) The protein levels of vimentin, fibronectin, collagen I, collagen III, α-SMA, c/EBPα, c/EBPβ, PPARγ, perilipin-1, FABP4, leptin, and adiponectin in orbital tissues were examined using Immunoblotting (n = 3, **P < 0.01 vs. the healthy control group; #P < 0.05, ##P < 0.01 vs. the GO group).
Figure 8.
Figure 8.
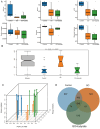
Butyrate alters the diversity of gut microbiota in the GO model mice. Fecal samples were collected from mice in different groups and applied for 16S rDNA sequencing for microbial community diversity analysis. (A) The α-diversity was evaluated using Faith_pd, Chao1, ACE, Goods_coverage, Simpson, and Observed. (B) The β-diversity was evaluated using Anosim. (C) PCA analysis was performed to evaluate the difference in the gut microbial community among the different groups. (D) Annotated operational taxonomic units (OTUs) within groups and overlapping among groups were shown in the Venn diagram (n = 6).
Figure 9.
Figure 9.
Butyrate alters the relative abundance of dominant species at the genus level . (A) Kruskal-Wallis analysis was performed to select the different bacteria among the groups, and the different bacteria were sorted according to the relative abundance; the top 10 bacteria were shown. (B) Hierarchical clustering heatmap showing the top 10 bacteria. (C) The relative abundance of the top 10 bacteria (n = 6, *P < 0.05, **P < 0.01 vs. the healthy control group; #P < 0.05 vs. the GO group).
Figure 10.
Figure 10.
Metabolic functions of gut microbiota predicted using PICRUSt2 . Available at: https://github.com/picrust/picrust2.
Figure 11.
Figure 11.
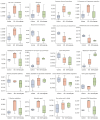
The difference of predicted metabolic functions of gut microbiota in the healthy control, the GO, and the GO + butyrate mice. (n = 6, *P < 0.05, **P < 0.01 vs. the healthy group; ##P < 0.01 vs. the GO group).

References

    1. Reddy SV, Jain A, Yadav SB, Sharma K, Bhatia E.. Prevalence of Graves' ophthalmopathy in patients with Graves' disease presenting to a referral centre in north India. Indian J Med Res. 2014; 139(1): 99–104. - PMC - PubMed
    1. Tellez M, Cooper J, Edmonds C.. Graves' ophthalmopathy in relation to cigarette smoking and ethnic origin. Clin Endocrinol (Oxf). 1992; 36(3): 291–294. - PubMed
    1. Wiersinga WM, Bartalena L.. Epidemiology and prevention of Graves' ophthalmopathy. Thyroid. 2002; 12(10): 855–860. - PubMed
    1. Tanda ML, Piantanida E, Liparulo L, et al. .. Prevalence and natural history of Graves' orbitopathy in a large series of patients with newly diagnosed graves' hyperthyroidism seen at a single center. J Clin Endocrinol Metab. 2013; 98(4): 1443–1449. - PubMed
    1. Draman MS, Zhang L, Dayan C, Ludgate M.. Orbital signaling in Graves' orbitopathy. Front Endocrinol (Lausanne). 2021; 12: 739994. - PMC - PubMed

MeSH terms

LinkOut - more resources