. 2025 Mar 4;135(8):e185292.
doi: 10.1172/JCI185292. eCollection 2025 Apr 15.

The saponin monophosphoryl lipid A nanoparticle adjuvant induces dose-dependent HIV vaccine responses in nonhuman primates

Affiliations

The saponin monophosphoryl lipid A nanoparticle adjuvant induces dose-dependent HIV vaccine responses in nonhuman primates

Parham Ramezani-Rad et al. J Clin Invest. .

Abstract

Induction of durable protective immune responses is the main goal of prophylactic vaccines, and adjuvants play a role as drivers of such responses. Despite advances in vaccine strategies, development of a safe and effective HIV vaccine remains a significant challenge. Use of an appropriate adjuvant is crucial to the success of HIV vaccines. Here we assessed the saponin/MPLA nanoparticle (SMNP) adjuvant with an HIV envelope (Env) trimer, evaluating the safety and effect of multiple variables - including adjuvant dose (16-fold dose range), immunization route, and adjuvant composition - on the establishment of Env-specific memory T and B cell (TMem and BMem) responses and long-lived plasma cells in nonhuman primates (NHPs). Robust BMem were detected in all groups, but a 6-fold increase was observed in the highest- versus the lowest-SMNP-dose group. Similarly, stronger vaccine responses were induced by the highest SMNP dose in CD40L+OX40+ CD4+ TMem (11-fold), IFN-γ+ CD4+ TMem (15-fold), IL21+ CD4+ TMem (9-fold), circulating T follicular helper cells (TFH; 3.6-fold), BM plasma cells (7-fold), and binding IgG (1.3-fold). Substantial tier 2 neutralizing antibodies were only observed in the higher-SMNP-dose groups. These investigations highlight the dose-dependent potency of SMNP and its relevance for human use and next-generation vaccines.

Keywords: AIDS vaccine; AIDS/HIV; Adaptive immunity; Immunology.


Figures

Figure 1
Figure 1. Saponin-based nanoparticles.
(A) Formulation of SMNP with Quil-A (laboratory grade) or QS-21 (GMP-process). (B) Representative TEM image of QS-21 SMNP. Scale bar: 100 nm.
Figure 2
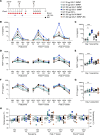
Figure 2. Increased plasma cytokine levels are detected with higher QS-21 SMNP doses.
(A) Overview of immunizations and sample collection schedule for NHPs. (BG) Mean plasma cytokine concentration at baseline (week 0, day 0 [Wk0 D0]) and days 1–5 (D1–D5) following immunizations: IL-6 (B and C), MCP-1 (D and E), and IP-10 (F and G). (H) Measurement of rectal body temperature in degrees Fahrenheit (left y axis) and Celsius (right y axis) at baseline (D0) or D1–3 following immunizations. Dotted line is set at 102.5°F/39.2°C and represents the temperature threshold for fever in NHPs. Bars represent median per group. In BG, error bars represent mean with SEM. Statistical significance was assessed using the Kruskal-Wallis test, followed by Dunn’s multiple-comparison test. *P ≤ 0.05, **P < 0.01, and ***P < 0.001. In C, E, and G, the dotted line represents the mean baseline (Wk0 D0) response of all groups. All data represent n = 6 animals/group.
Figure 3
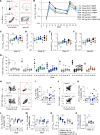
Figure 3. Robust longitudinal Env-binding BMem are detected with high QS-21 SMNP doses.
(A) Representative flow cytometry plots of Env-binding BMem (Env-BV421+Env-AF647+) and Env bKO-binding BMem (bKO-PE+) in PBMCs at weeks 10 and 12. (B) Env-binding BMem as a percentage of total B cells (medians per group) in PBMCs at different time points after immunization. Black triangles indicate times of immunizations. The LOD for Env-binding BMem was 0.0006%. (C and D) Frequency of Env-binding BMem in PBMCs at week 12 (C) and week 26 (D). (E and F) Frequency of bKO-binding BMem in PBMCs at week 12 (E) and week 26 (F). (G) bKO-binding BMem as a percentage of Env-binding BMem. (H) Representative flow cytometry plots of total BGC (CD71+CD38) and Env-binding BGC (Env-BV421+Env-AF647+) in ipsilateral LN FNAs at weeks 6 and 13. (I) Frequency of total BGC in ipsilateral LN FNAs at weeks 6 and 13. (J) Representative flow cytometry plots of GC-TFH (PD-1hiCXCR5+) in ipsilateral LN FNAs at weeks 6 and 13. (K) Frequency of GC-TFH in ipsilateral LN FNAs at weeks 6 and 13. (L) Frequency of Env-binding BGC in ipsilateral LN FNAs at weeks 6 and 13. (M) Frequency of Env-binding BMem in ipsilateral LN FNAs at weeks 6 and 13. (N) Frequency of Env-binding BMem compared across 3 different tissues (PBMCs, ipsilateral LN, and contralateral LN). (O) Frequency of Env-binding BMem in contralateral LN FNAs at week 13. Bars represent the median per group. Gray area in L, M, and O indicates the LOD. Statistical significance was assessed using the Kruskal-Wallis test, followed by Dunn’s multiple-comparison test. *P ≤ 0.05 and **P < 0.01. All data represent n = 6 animals/group unless the exclusion criteria described in Methods apply.
Figure 4
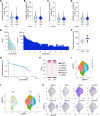
Figure 4. Single B cell sequencing of Env-binding BMem in low- and high-dose QS-21 SMNP groups.
(A and B) Number of HC nucleotide mutations in Env-binding BMem (A) and bKO-binding BMem (B) at week 12 in PBMCs. G, group. (C and D) Number of LC κ (C) and LC λ (D) mutations in Env-binding BMem at week 12. (E) Distribution of clonotype sizes for groups 2 and 4. (F) Clonal richness (Chao1) of Env-binding BMem. (G) Clonal abundance curve of Env-binding BMem. (H) Proportion of Ig isotypes among Env-binding BMem, shown as a percentage of total IGH. (IK) Uniform manifold approximation and projection (UMAP) visualization of single-cell gene expression profiles identifying clusters of total Env-binding BMem at week 12 (I) across groups (J) and for specific markers (K). In AD, the solid black line and dotted lines represent the median and quartiles, respectively. The error bars in F represent the geometric mean with geometric SD. Animals were excluded from clonal abundance curve in G if fewer than 50 sequences were recovered; otherwise, all data represent n = 6 animals/group. Statistical significance was assessed using an unpaired 2-tailed Mann-Whitney U test.
Figure 5
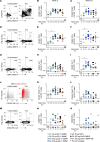
Figure 5. Robust Env-specific T cells are detected with all QS-21 SMNP doses after priming.
(A) Representative flow cytometry plots of AIM+ (OX40+CD40L+) CD4+ T cells from unstimulated or Env peptide pool–stimulated samples at week 2. (B and C) Frequency of AIM+ (OX40+CD40L+) Env-specific CD4+ T cells at week 2 (B) and week 24 (C). (D) Representative flow cytometry plots of CD40L+IFN-γ+ CD4+ T cells from unstimulated or Env peptide pool–stimulated samples at week 2. (E and F) Frequency of CD40L+IFN-γ+ Env-specific CD4+ T cells at week 2 (E) and week 24 (F). (G) Representative flow cytometry plots of CD40L+IL-21+ CD4+ T cells from unstimulated or Env peptide pool–stimulated samples at week 2. (H and I) Frequency of CD40L+IL-21+ CD4+ T cells at week 2 (H) and week 24 (I). (J) Representative flow cytometry plots of cTFH (CXCR5+) with AIM+ (OX40+CD40L+) (red) at week 2. (K and L) Frequency of AIM+ (OX40+CD40L+) Env-specific cTFH at week 2 (K) and week 24 (L). (M) Representative flow cytometry plots of CD69+IFN-γ+ CD8+ T cells from unstimulated or Env peptide pool-stimulated samples at week 2. (N and O) Frequency of CD69+IFN-γ+ Env-specific CD8+ T cells at week 2 (N) and week 24 (O). Horizontal bars represent the geometric mean per group. Black dotted lines indicate the LOQ. Percent responders was calculated as the percentage of animals with levels above the LOQ. Frequencies are shown after subtraction from paired unstimulated samples. Statistical significance was assessed using the Kruskal-Wallis test, followed by Dunn’s multiple-comparison test. *P ≤ 0.05 and **P < 0.01. All data represent n = 6 animals per group, except for group 1, which had n = 5 at week 2. Preimmunization data (n = 14) were derived from different groups of animals.
Figure 6
Figure 6. Higher induction of Env-specific BM BPC and neutralizing antibodies with high QS-21 SMNP doses.
(A) Mean AUC of Env-binding IgG antibodies at different time points after immunization. Black triangles represent the time of immunization. (BD) AUC of Env-binding IgG antibodies at week 12 (B), week 24 (C), and week 26 (D). (EH) Serum dilution at 50% inhibition of BG505 pseudovirus in a neutralization assay (ID50) at week 10 (E), week 12 (F), week 26 (G), and week 30 (H). (I) Correlation between AUC of Env-binding IgG antibodies and neutralization titers at week 30. (J) Frequency of Env+ IgG+ BPC in BM at week 37. (K and L) Correlation between AUC of Env-binding IgG antibodies at week 12 (K) or week 30 (L) and frequency of Env+ IgG+ BPC. Error bars in BD represent mean with SEM. Horizontal black lines in EH and J indicate geometric mean and median, respectively. The dotted black line in J indicates the LOD and was used to calculate percent responders. Statistical significance (BD and J) was assessed using the Kruskal-Wallis test, followed by Dunn’s multiple-comparison test; and in EH was assessed using an unpaired 2-tailed Mann-Whitney U test. Data in I, K, and L were analyzed using Spearman’s correlation test. *P ≤ 0.05 and **P < 0.01. All data represent n = 6 animals/group.

Update of

References

    1. Del Giudice G, et al. Correlates of adjuvanticity: a review on adjuvants in licensed vaccines. Semin Immunol. 2018;39:14–21. doi: 10.1016/j.smim.2018.05.001. - DOI - PubMed
    1. Pulendran B, et al. Emerging concepts in the science of vaccine adjuvants. Nat Rev Drug Discov. 2021;20(6):454–475. doi: 10.1038/s41573-021-00163-y. - DOI - PMC - PubMed
    1. Singh A, et al. Optimizing the immunogenicity of HIV vaccines by adjuvants - NIAID workshop report. Vaccine. 2023;41(31):4439–4446. - PubMed
    1. Crotty S. T Follicular helper cell biology: a decade of discovery and diseases. Immunity. 2019;50(5):1132–1148. - PMC - PubMed
    1. Garçon N, et al. Development of an AS04-adjuvanted HPV vaccine with the adjuvant system approach. BioDrugs. 2011;25(4):217–226. doi: 10.2165/11591760-000000000-00000. - DOI - PubMed