. 2025 Mar 18;19(10):10173-10179.
doi: 10.1021/acsnano.4c17299. Epub 2025 Mar 4.

Electrostatic All-Passive Force Clamping of Charged Nanoparticles

Affiliations

Electrostatic All-Passive Force Clamping of Charged Nanoparticles

Yazgan Tuna et al. ACS Nano. .

Abstract

In the past decades, many techniques have been explored for trapping microscopic and nanoscopic objects, but the investigation of nano-objects under arbitrary forces and conditions remains nontrivial. One fundamental case concerns the motion of a particle under a constant force, known as force clamping. Here, we employ metallic nanoribbons embedded in a glass substrate in a capacitor configuration to generate a constant electric field on a charged nanoparticle in a water-filled glass nanochannel. We estimate the force fields from Brownian trajectories over several micrometers and confirm the constant behavior of the forces both numerically and experimentally. Furthermore, we manipulate the diffusion and relaxation times of the nanoparticles by tuning the charge density on the electrode. Our highly compact and controllable setting allows for the trapping and force-clamping of charged nanoparticles in a solution, providing a platform for investigating nanoscopic diffusion phenomena.

Keywords: electrostatic trapping; force clamp; force spectroscopy; gold nanoparticles; nanofluidics; particle tracking; potential mapping.


Conflict of interest statement

The authors declare no competing financial interest.

Figures

Figure 1
Figure 1
Schematics of the experimental setup. Three ITO electrodes are embedded in a silica substrate. A second silica substrate is bonded on top to form a nanochannel of height h over a length of 7 mm in the y direction. A gold nanoparticle (GNP) of 80 nm in diameter diffuses in water inside this nanochannel. A microscope objective is used to image and monitor the GNP via wide-field iSCAT microscopy. Various relevant dimensions and information are presented in two nested close-ups.
Figure 2
Figure 2
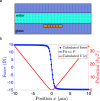
Electrostatic force fields and potentials. (a) Force field generated by a charged 3-electrode capacitor (see Figure 1) on a negatively charged particle (100 e). Arrowheads show the direction of the force. The length of the arrows is normalized. (b) Electrostatic force (blue) and potential (red) as a function of the lateral displacement x evaluated at the midplane of the channel (see dashed line in (a)).
Figure 3
Figure 3
Portion of a trajectory and distorted point spread functions. A 3 s section of a 48.6 s long trajectory is overlaid on the position of the nanoribbon (gray shaded area). Colors encode the temporal evolution of the trajectory: blue marks its beginning and yellow marks its end. Representative interferometric point spread functions (iPSF) after background subtraction are depicted in the red boxes on the sides. The central parts of the iPSFs are somewhat distorted due to scattering from the electrode, while the outer rings remain mostly unperturbed. The dashed red circles represent the region where the rings are used for particle localization. Scale bars indicate 1 μm.
Figure 4
Figure 4
Measured force field and tunability. (a) Blue circles show the estimated force from 107 rescaled experimental trajectories. The solid red line is a fit according to eq 3. We find that the force becomes constant for |x| ≳ 1 μm. (b) Linear dependence of the force (blue circles) on the applied voltage for the trajectory of a single particle depicted in each inset. Colors encode the temporal evolution of the trajectory: blue marks its beginning and yellow marks its end. Error bars correspond to one standard deviation. The red line indicates a linear fit function.
Figure 5
Figure 5
Mean squared displacement. (a) Three exemplary experimental trajectories for estimated weak ( = 1.8 fN), moderate ( = 7.4 fN) and strong ( = 18.3 fN) forces. Each trajectory was 50 s long. Blue and yellow encode the beginning and the end of the trajectory, respectively. (b) Measured mean square displacements (MSD) for the corresponding trajectories (dots) are compared against the numerical (solid lines) and asymptotic analytical predictions (dashed gray lines). Relaxation times decrease with increasing force.

References

    1. Roca-Cusachs P.; Conte V.; Trepat X. Quantifying forces in cell biology. Nat. Cell Biol. 2017, 19, 742–751. 10.1038/ncb3564. - DOI - PubMed
    1. Fletcher D. A.; Mullins R. D. Cell mechanics and the cytoskeleton. Nature 2010, 463, 485–492. 10.1038/nature08908. - DOI - PMC - PubMed
    1. Liu B.; Chen W.; Zhu C. Molecular Force Spectroscopy on Cells. Annu. Rev. Phys. Chem. 2015, 66, 427–451. 10.1146/annurev-physchem-040214-121742. - DOI - PubMed
    1. Howard J.Mechanics of Motor Proteins and the Cytoskeleton; Sinauer Associates Publishers, 2001.
    1. Ashkin A.; Schütze K.; Dziedzic J. M.; Euteneuer U.; Schliwa M. Force generation of organelle transport measured in vivo by an infrared laser trap. Nature 1990, 348, 346–348. 10.1038/348346a0. - DOI - PubMed

LinkOut - more resources