. 2025 Feb 27;53(5):gkaf105.
doi: 10.1093/nar/gkaf105.

Packaged delivery of CRISPR-Cas9 ribonucleoproteins accelerates genome editing

Affiliations

Packaged delivery of CRISPR-Cas9 ribonucleoproteins accelerates genome editing

Hannah Karp et al. Nucleic Acids Res. .

Abstract

Effective genome editing requires a sufficient dose of CRISPR-Cas9 ribonucleoproteins (RNPs) to enter the target cell while minimizing immune responses, off-target editing, and cytotoxicity. Clinical use of Cas9 RNPs currently entails electroporation into cells ex vivo, but no systematic comparison of this method to packaged RNP delivery has been made. Here we compared two delivery strategies, electroporation and enveloped delivery vehicles (EDVs), to investigate the Cas9 dosage requirements for genome editing. Using fluorescence correlation spectroscopy, we determined that >1300 Cas9 RNPs per nucleus are typically required for productive genome editing. EDV-mediated editing was >30-fold more efficient than electroporation, and editing occurs at least 2-fold faster for EDV delivery at comparable total Cas9 RNP doses. We hypothesize that differences in efficacy between these methods result in part from the increased duration of RNP nuclear residence resulting from EDV delivery. Our results directly compare RNP delivery strategies, showing that packaged delivery could dramatically reduce the amount of CRISPR-Cas9 RNPs required for experimental or clinical genome editing.


Conflict of interest statement

The Regents of the University of California have patents issued and pending for CRISPR technologies on which J.D. is an inventor and for delivery technologies on which J.D. and W.N. are co-inventors. J.D. is a cofounder of Azalea Therapeutics, Caribou Biosciences, Editas Medicine, Evercrisp, Scribe Therapeutics, Intellia Therapeutics, and Mammoth Biosciences. J.D. is a scientific advisory board member at Evercrisp, Caribou Biosciences, Scribe Therapeutics, The Column Group and Inari. She also is an advisor for Aditum Bio. J.D. is Chief Science Advisor to Sixth Street, a Director at Johnson & Johnson, Altos and Tempus, and has a research project sponsored by Apple Tree Partners. A.S. has research projects sponsored by Novo Nordisk, Amgen and Merck. All other authors have no competing interests.

Figures

Graphical Abstract
Graphical Abstract
Figure 1.
Figure 1.
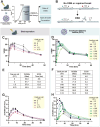
Quantifying Cas9 RNP nuclear concentration delivered by electroporation with FCS. (A) Experimental schematic of workflow to quantify the Cas9 RNP nuclear concentration required for editing. (B) Diffusion time of Cas9 RNP or gRNA, in Cas9 per cell, delivered in HeLa cells and measured at 24 h (2.0 ms versus 1.0 ms, P-value = .0004) Each point represents the average diffusion time in an individual cell modeled with a two-component diffusion fitting (Supplementary Fig. S1). FCS diffusion times are provided in ms; n > 25 for each FCS condition with at least two biological replicates each [mean ± standard error of the mean (SEM)]. (C) FCS analysis of HeLa cells electroporated with the Cas9 RNP. Nuclear concentration of Cas9 RNP as a function of dosage (in Cas9 per cell). Each point represents the concentration in an individual cell. FCS values are provided in nM; n > 25 for each FCS condition with at least two biological replicates each (mean ± SEM). All concentration values and diffusion times were derived by fitting FCS traces with a two-component 3D diffusion equation (see the “Materials and methods” section for more details). (D) (Left axis) Average nuclear concentration of Cas9 RNP versus dosage shows a strong linear correlation (R2 = 0.96). (Right axis) Estimated number of Cas9 per nucleus calculated from nuclear concentration values measured by FCS and volume of HeLa nucleus (690 μm3) [39]. (E) FCS analysis of nuclear concentration for HeLa, U2OS, and HEK293T cells. FCS values are provided in nM; n > 20 for each FCS condition with at least two biological replicates each (mean ± SEM). Exact values for FCS, including experimental and biological replicates, mean, and SEM, are reported in Supplementary Table S2.
Figure 2.
Figure 2.
Assessing dosage requirements of Cas9 RNP delivered by electroporation and EDVs. (A) Experimental schematic of workflow to quantify the Cas9 RNP doses required for editing by electroporation and EDVs. (B) To assess Cas9 RNP dosage required for editing, HEK293T and HeLa cells were treated with varying doses of B2M-targeting Cas9 by electroporation and EDVs. Analysis was performed by flow cytometry 4 days post-treatment to assess B2M knockdown. (C) Electroporation and (D) EDV delivery of Cas9 RNP targeting the B2M, VEGFA, EMX1, and CCR5 loci in HEK293T cells. Analysis was performed by NGS 4 days post-treatment to assess indels. (E) Comparison of required RNP doses required for half maximal editing (EC50) delivered by electroporation and EDV for nine different B2M guides in HEK293T (P-value = .0003, Mann–Whitney). Analysis was performed by flow cytometry 4 days post-treatment to assess B2M knockout. n = 3 technical replicates were used in all experiments. Data points represent the mean with error bars displaying standard deviation (SD). RNP dose curves were modeled (Prism v10) as sigmoidal (4PL, X is concentration).
Figure 3.
Figure 3.
Kinetics of double-strand breaks and DNA repair resulting from delivery by RNP electroporation and EDVs. (A) Schematic overview of time course experiment comparing the impact of saturating doses, defined as doses at or exceeding levels for 90% of the maximum editing (>EC90), of Cas9 RNP delivered by electroporation and EDVs on the rate of double-strand breaks and consequent indel repair detected by NGS. (B) Experimental setup of the ddPCR used to quantitatively detect DSBs. An HEX probe spans the first amplicon that is centromere proximal to the break site. A second FAM probe anneals to the second amplicon, which is lost upon DSB or chromosome loss. DSBs caused by (C) electroporation and (D) EDV delivery of Cas9 RNP targeting the B2M locus over a 54-h time frame. t = 0 time points represent the baseline readout prior to Cas9 delivery by electroporation or EDVs. Tables comparing the maximum percentage of synchronous DSBs and time frame for half maximal editing (EC50) resulting from delivery of B2M-targeting RNP in HEK293T by (E) electroporation and (F) EDV delivery. Rate of indel formation caused by (G) electroporation and (H) EDV delivery of B2M-targeting RNP in HEK293T cells measured by NGS (raw NGS time courses in Supplementary Fig. S7). All doses are at levels that meet or exceed the amount necessary for 90% maximal editing. n = 3 technical replicates were used in all experiments. Data points represent the mean with error bars displaying SD.
Figure 4.
Figure 4.
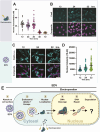
Comparison of nuclear localization and concentration of Cas9 delivered by electroporation and EDVs as function of time. (A) Quantification of the nuclear concentration of Cas9 RNP in HeLa cells by FCS at 12, 24, 36, 48, and 72 h post-electroporation (7.5 × 107 Cas9 per cell). Each point represents the concentration in an individual cell. FCS values are provided in nM; n > 25 for each FCS condition with at least two biological replicates each (mean ± SEM). All concentration values and diffusion times were derived by fitting FCS traces with a two-component 3D diffusion equation (see the “Materials and methods” section). Representative fixed confocal images of HeLa cells stained for Cas9 (top) and composite image of Cas9 overlaid with nuclear counterstain (SYTOX™ Deep Red Nucleic Acid Stain) showing the nuclear intensity of Cas9 at 12, 24, and 36 h following (B) electroporation (1.2 × 108 Cas9 per cell) and (C) EDV treatment (∼3.0 × 106 Cas9 per cell). Scale bar is 25 μm. (D) Relative quantification of median nuclear intensity of Cas9 delivered by EDV at 12, 24, and 36 h (see the “Materials and methods” section). Intensity on 16-bit scale (0–65 536). Each data point represents an individual nuclei, n > 40 (mean ± SEM). (E) Schematic overview of Cas9 delivery by EDVs and electroporation.

Update of

References

    1. Raguram A, Banskota S, Liu DR Therapeutic in vivo delivery of gene editing agents. Cell. 2022; 185:2806–27. 10.1016/j.cell.2022.03.045. - DOI - PMC - PubMed
    1. Sinclair F, Begum AA, Dai CC et al. Recent advances in the delivery and applications of nonviral CRISPR/Cas9 gene editing. Drug Deliv Transl Res. 2023; 13:1500–19. 10.1007/s13346-023-01320-z. - DOI - PMC - PubMed
    1. Jang H-K, Jo DH, Lee S-N et al. High-purity production and precise editing of DNA base editing ribonucleoproteins. Sci Adv. 2021; 7:eabg2661. 10.1126/sciadv.abg2661. - DOI - PMC - PubMed
    1. Cameron P, Fuller CK, Donohoue PD et al. Mapping the genomic landscape of CRISPR–Cas9 cleavage. Nat Methods. 2017; 14:600–6. 10.1038/nmeth.4284. - DOI - PubMed
    1. Hendel A, Bak RO, Clark JT et al. Chemically modified guide RNAs enhance CRISPR–Cas genome editing in human primary cells. Nat Biotechnol. 2015; 33:985–9. 10.1038/nbt.3290. - DOI - PMC - PubMed

Substances