. 2025 May 13;9(9):2321-2335.
doi: 10.1182/bloodadvances.2024015271.

Interplay between iron metabolism, inflammation, and EPO-ERFE-hepcidin axis in RDEB-associated chronic anemia

Affiliations

Interplay between iron metabolism, inflammation, and EPO-ERFE-hepcidin axis in RDEB-associated chronic anemia

Lucía Quintana-Castanedo et al. Blood Adv. .

Abstract

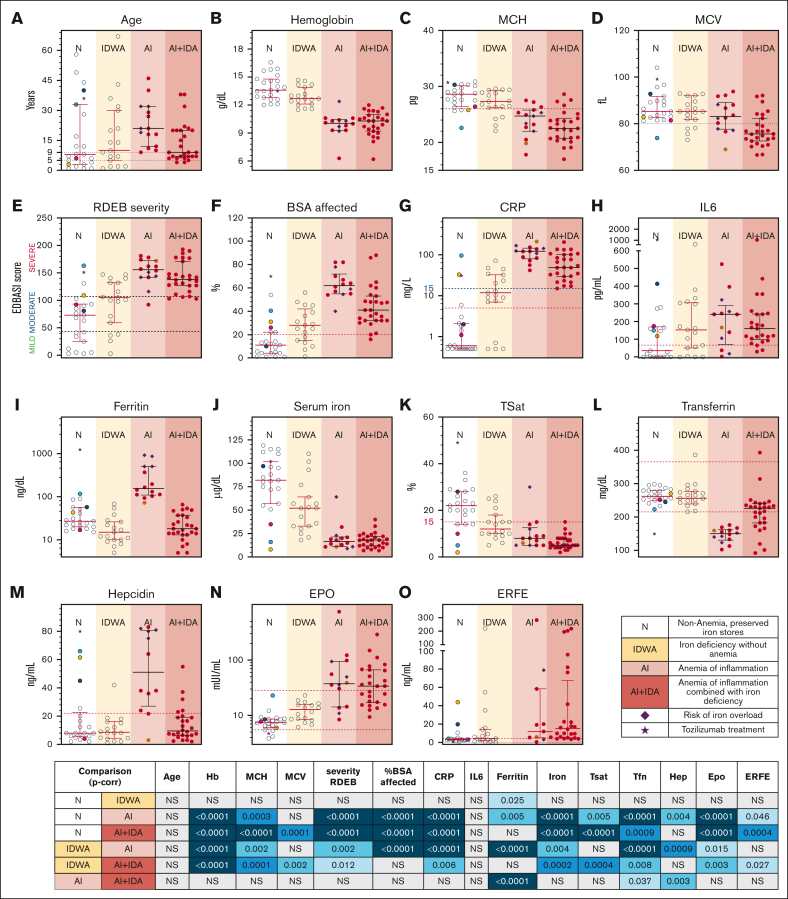
Recessive dystrophic epidermolysis bullosa (RDEB) is a genodermatosis characterized by severe cutaneous and mucosal fragility, and frequently complicated by multifactorial chronic anemia that responds poorly to conventional therapies. This cross-sectional study investigates the factors contributing to anemia in RDEB by analyzing a representative cohort, that was stratified by disease severity, anemia, and iron status, to examine their hematological parameters, cytokine profile, and the erythropoietin-erythroferrone-hepcidin (EPO-ERFE-hepcidin) axis. Anemia was present in 50% of the cohort. Hemoglobin levels showed a strong negative correlation with the percentage of body surface area affected and C-reactive protein levels (CRP), identifying these as anemia risk factors in RDEB. Moderate-severe inflammation (CRP ≥ 15 mg/L) was observed in all patients with anemia, but no specific cytokine profile was linked with anemia risk because of variability in interleukin-6 (IL-6), IL-1β, IL-10, tumor necrosis factor, and interferon-γ levels. The regulation of the EPO-ERFE-hepcidin axis showed discrepancies with the patterns expected based on patients' anemia severity and iron status. According to the reticulocyte production index, an inadequate bone marrow response was observed in 90% of patients with anemia, irrespective of EPO levels. Patients with functional or true iron deficiency had higher ERFE levels, although ERFE showed no consistent correlation with EPO and was elevated in both patients with anemia and those without anemia. Elevated hepcidin was primarily linked to the highest ferritin levels, mostly in patients with a history of iron infusions and/or transfusions. These findings highlight the need for personalized, targeted approaches that address the complex interplay between inflammation and iron dysregulation, to improve anemia management in RDEB and other chronic inflammatory conditions.


Conflict of interest statement

Conflict-of-interest disclosure: The authors declare no competing financial interests.

Figures

None
Graphical abstract
Figure 1.
Figure 1.
Risk factors for anemia in RDEB. (A-D) Hemoglobin (Hb) levels across different ages (A), and their correlation with RDEB disease severity (EBDASI total scores: mild, moderate, and severe) (B), the percentage of BSA affected (C), and CRP (log scale) (D), in patients with RDEB (n = 84). Symbols represent RDEB disease severity (green triangles, mild; blue squares, moderate; and red circles, severe) and anemia status (open, no anemia; filled, anemia). Patient on tocilizumab treatment (severe, without anemia) is depicted as a black star. Blue dashed vertical lines indicate proposed cutoff values for anemia risk factors (C-D, see text). Red dashed line represents the NR for CRP (D). Black lines show linear regression fits (B-C) or semilogarithmic regression (D) with dotted lines indicating 95% confidence intervals. ρ = Spearman rank-order correlation coefficient; R2 = coefficient of determination. (E) Patients were categorized based on a cumulative score (0-3 points) by meeting up to 3 criteria: age of ≥5 years, CRP of ≥15 mg/L, and percent BSA affected of ≥20%, each counting 1 point. A score of 3 points showed a specificity of 78.6%, a sensitivity of 92.9%, and a positive predictive value of 83.2% for the presence of anemia.
Figure 2.
Figure 2.
Inflammatory cytokines in patients with RDEB who have anemia and those without anemia. Individual levels of IL-6, IL-1β, TNF, IFN-γ, and IL-10 are shown for HCs (black squares; n = 71) and patients with RDEB stratified by anemia status (no anemia, open symbols, n = 39-40; with anemia, filled symbols, n = 37-39) and disease severity EBDASI score (mild = Mi, n = 13, green triangle; moderate = Mo, blue square; severe = S, red circle). Patient on tocilizumab treatment is depicted as a black star. Statistical significance was assessed for comparing HCs vs patients with RDEB who do not have anemia (NA) and those who do (Anem). Among patients with RDEB, comparisons were made between groups without anemia by severity classifications (NA-Total, NA-Mi, NA-Mo + S) and patients with anemia. Statistical analysis: Kruskal-Wallis (K-W) test followed by the Dunn multiple comparison test (P-value adjusted for multiple comparisons, p-corr). NS (nonsignificant) indicates statistical results for which P >.05. Error bars represent median and interquartile range. Dashed horizontal red lines indicate HC 95th percentile (IL-6, IL-1β, TNF, IL-10) or 90th percentile (IFN-γ) used as cutoff for cytokines.
Figure 3.
Figure 3.
Inflammation and iron status in patients with RDEB. (A-B) Correlation of serum iron (Fe) with Hb values (A, n = 83) and IL-6 levels (B, n = 78). Patient who are normoferropenic are indicated by a “+.” ρ = Spearman rank-order correlation coefficient. Dashed vertical red line indicates HC 95th percentile used as cutoff for IL-6. (C) Semilogarithmic correlation between CRP (log scale) and Fe levels in the blood (n = 81). Note, most patients with CRP of ≥15 mg/L (blue dashed line) have iron of <40 μg/dL (horizontal red dashed line). (D) Criteria for classification of patients’ iron status by age, and CRP and ferritin serum levels, adapted from World Health Organization guidelines (https://www.who.int/publications/i/item/9789240000124). (E) CRP (log scale) and ferritin (log scale) levels in the blood of patients with RDEB, showing the distribution of iron status, inflammation, and anemia risk across EBDASI severity categories. Symbols represent RDEB disease severity and anemia status as described in Figure 1. Patient on tocilizumab treatment is depicted as a star. (F) Distribution of anemia prevalence across the RDEB cohort by inflammatory state, iron status, and age group. Patients are categorized as having IDWA, AI, or AI + IDA. TSat is included as a marker of iron availability.
Figure 4.
Figure 4.
Hepcidin in patients with RDEB and its relationship with anemia, inflammation, and iron status. (A) Individual levels of blood hepcidin (ng/mL) in HCs (n = 70) and patients with RDEB classified according to their anemia status and EBDASI score as described in Figure 2: without anemia (NA, Mi [n = 11], and Mo-S [n = 28]); and with anemia (n = 38). K-W test followed by the Dunn multiple comparison test (p-corr). (B) Descriptive statistics of blood hepcidin levels in HCs and patients with RDEB (with anemia and without anemia), including median, mean, standard deviation (SD), and range values. Mann-Whitney U test (M-W) was used to compare HCs vs patients with RDEB and patients without anemia vs those with anemia. The χ2 test was applied to evaluate the distribution of patients with hepcidin levels above the reference cutoff (HC 90th percentile, 22 ng/mL). (C) Correlation of hepcidin levels with clinical and biochemical blood parameters related to anemia, RDEB severity, inflammation, and iron metabolism. Patients with anemia, red circles; patients without anemia, open circles. Note the patient in yellow. ρ = Spearman rank-order correlation coefficient. (D) Hepcidin levels in patients classified by iron status following criteria described in Figure 3D. Iron NR indicates preserved iron stores. Note the small number of patients with ID and elevated hepcidin. K-W test followed by the Dunn multiple comparison test (p-corr). (E) Tsat in patients classified by hepcidin level cutoff (>22 ng/mL = hepcidin-high) and iron status. Note the high proportion of patients with ID without increased hepcidin levels and those with increased hepcidin and TSat of <15%. M-W test (P value). Horizontal dashed red lines indicate cutoff for hepcidin (22 ng/mL; panels A, C, and D) or TSat of <15% (E). The patient on tocilizumab treatment is depicted as a black star. NS, nonsignificant; P > .05.
Figure 5.
Figure 5.
EPO levels in patients with RDEB in relation to anemia. (A) Semilogarithmic correlation of serum Hb and EPO levels (n = 81). Patients were classified according to their anemia status and EBDASI score as described in Figure 1: no anemia (n = 41; Mi, n = 13; Mo-S, n = 28) and anemia (n = 40). Dashed red lines represent NR for EPO levels. Black lines: semilogarithmic regression (continuous) and 95% CI (dotted). ρ = Spearman rank-order correlation coefficient. (B) Descriptive statistics of EPO levels in patients with RDEB, including median, mean, SD, and range values. M-W test was used to compare levels in patients who are nonanemic vs patients with anemia. The χ2 test was applied to evaluate the distribution of patients classified by EPO NR. (C) Comparison of patients with RDEB who are anemic stratified by EPO response, EPO levels at NR (n = 14-16), or EPO above NR (>NR, n = 21-24). Error bars: median and interquartile range. Statistical analysis: M-W test. NS; P > .05. CI, confidence interval; NS, nonsignificant.
Figure 6.
Figure 6.
Systemic levels of ERFE in patients with RDEB: relationship with anemia, inflammation, and iron status. (A) Individual levels of ERFE (ng/mL) in HCs (n = 70) and patients with RDEB (n = 74), classified according to their anemia status and EBDASI severity category, as described in Figure 2. K-W test followed by the Dunn multiple comparison test (p-corr). Error bars: median and interquartile range. (B) Descriptive statistics of blood ERFE levels in HCs and patients with RDEB (with anemia and without anemia), including median, mean, SD, and range values. M-W test was used to compare HCs vs patients with RDEB and patients who are nonanemic vs patients with anemia. The χ2 was applied to evaluate the distribution of patients with ERFE levels above the reference cutoff (HC 95th percentile, 4.5 ng/mL). (C) Correlation of ERFE levels with clinical and biochemical blood parameters related to anemia, RDEB severity, inflammation, and iron metabolism. Patients with anemia, red circles; patients without anemia, open circles. Spearman rank-order test, ρ = correlation coefficient. (D) ERFE levels in patients classified by iron status following criteria described in Figure 3D. Iron NR indicates preserved iron stores. Statistical analysis: M-W test. (E) TSat in patients classified by ERFE level cutoff and iron status. Iron NR, indicates iron stores at NR. Statistical analysis: M-W test. Dashed lines represent NRs for standard laboratory parameters or reference cutoff points based on HC reference percentiles (ERFE, IL-6, hepcidin). Error bars: median and interquartile range. NS, nonsignificant; P > .05.
Figure 7.
Figure 7.
Multiparametric analysis of patients classified by anemia and iron status. Patients classified as: without anemia and preserved iron stores (N, n = 23-19), with IDWA (n = 19-18), with AI (n = 14-11), and with AI + IDA, n = 27-24). Patients at RIOL (n = 5-3) are marked in magenta, with the patient on tocilizumab indicated by a magenta star. In all panels, the patients with values of interest (N and AI group) are consistently highlighted using the same color across the different graphs to allow a multiparametric understanding. Statistical analysis: K-W test followed by the Dunn multiple comparison test (p-corr). Error bars: median and interquartile range. RDEB severity is measured by EBDASI score. Hep, hepcidin; MCH, mean corpuscular hemoglobin; MCV, mean corpuscular volume; NS, nonsignificant, P > .05; Tfn, transferrin.

References

    1. Bardhan A, Bruckner-Tuderman L, Chapple ILC, et al. Epidermolysis bullosa. Nat Rev Dis Primers. 2020;6(1):78. 27. - PubMed
    1. Tarango C, Quinn CT, Augsburger B, Lucky AW. Iron status and burden of anemia in children with recessive dystrophic epidermolysis bullosa. Pediatr Dermatol. 2023;40(2):288–293. - PubMed
    1. Hwang SJE, Daniel BS, Fergie B, Davey J, Murrell DF. Prevalence of anemia in patients with epidermolysis bullosa registered in Australia. Int J Womens Dermatol. 2015;1(1):37–40. - PMC - PubMed
    1. Reimer A, Hess M, Schwieger-Briel A, et al. Natural history of growth and anaemia in children with epidermolysis bullosa: a retrospective cohort study. Br J Dermatol. 2020;182(6):1437–1448. - PubMed
    1. Popp C, Miller W, Eide C, Tolar J, McGrath JA, Ebens CL. Beyond the surface: a narrative review examining the systemic impacts of recessive dystrophic epidermolysis bullosa. J Invest Dermatol. 2024;144(9):1943–1953. - PubMed