. 2025 May 8;15(5):jkaf047.
doi: 10.1093/g3journal/jkaf047.

Genetic suppression interactions are highly conserved across genetically diverse yeast isolates

Affiliations

Genetic suppression interactions are highly conserved across genetically diverse yeast isolates

Claire Paltenghi et al. G3 (Bethesda). .

Abstract

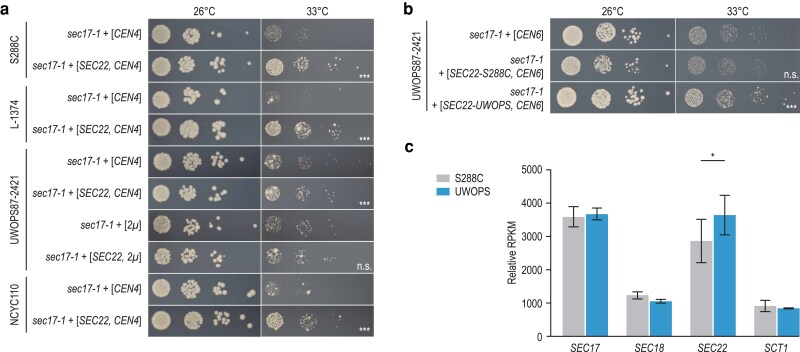
Genetic suppression occurs when the phenotypic defects caused by a deleterious mutation are rescued by another mutation. Suppression interactions are of particular interest for genetic diseases, as they identify ways to reduce disease severity, thereby potentially highlighting avenues for therapeutic intervention. To what extent suppression interactions are influenced by the genetic background in which they operate remains largely unknown. However, a high degree of suppression conservation would be crucial for developing therapeutic strategies that target suppressors. To gain an understanding of the effect of the genetic context on suppression, we isolated spontaneous suppressor mutations of temperature-sensitive alleles of SEC17, TAO3, and GLN1 in 3 genetically diverse natural isolates of the budding yeast Saccharomyces cerevisiae. After identifying and validating the genomic variants responsible for suppression, we introduced the suppressors in all 3 genetic backgrounds, as well as in a laboratory strain, to assess their specificity. Ten out of 11 tested suppression interactions were conserved in the 4 yeast strains, although the extent to which a suppressor could rescue the temperature-sensitive mutant varied across genetic backgrounds. These results suggest that suppression mechanisms are highly conserved across genetic contexts, a finding that is potentially reassuring for the development of therapeutics that mimic genetic suppressors.

Keywords: Saccharomyces cerevisiae; budding yeast; compensatory evolution; context-dependency; genetic interactions; genetic suppression.


Conflict of interest statement

Conflicts of interest: The authors declare no conflict of interest.

Figures

Fig. 1.
Fig. 1.
Systematic identification of genetic suppressors in diverse genetic backgrounds. a) Phylogenetic tree of Saccharomyces cerevisiae, indicating the yeast isolates that were used in this study. Adapted from Batté et al. 2025. b) Validating the suppression phenotype of isolated suppressor strains. Three TS alleles (sec17-1, tao3-5010, and gln1-5007) were introduced into 3 natural yeast isolates (L-1374, UWOPS87-2421, and NCYC110) and 3 independent, spontaneous suppressors of the TS phenotype were isolated in each background. An example of isolated suppressor strains of TS allele sec17-1 in genetic background L-1374 is shown here, all other combinations are shown in Supplementary Fig. 1. Cultures of the isolated suppressor strains, as well as of the corresponding parental TS strain without a suppressor, were grown until saturation, and a series of 10-fold dilutions was spotted on YPD plates. Plates were incubated at the indicated temperatures for 2 days. The wild-type natural isolate (without TS allele) was included as a control. c) The genomes of all suppressor colonies, as well as the parental TS strains without suppressor, were sequenced. Shown is the average sequencing read depth per yeast chromosome for each of the strains. Darker shades indicate the presence of additional copies of the affected chromosome. d) Validation of candidate suppressor genes. For candidate suppressor genes that were either located on one of the aneuploid chromosomes or that carried a nonsynonymous mutation, we tested the effect of deletion and/or overexpression of the genes on the temperature sensitivity of the query mutants. Details on detected SNPs and aneuploidies can be found in Supplementary Data 2 and 3. Spot dilution assays of the suppressor validation experiments are shown in Figs. 2–4 and Supplementary Figs. 2–4, and results are summarized in Supplementary Data 4.
Fig. 2.
Fig. 2.
Conservation of genetic suppression. a–c) For each of the detected suppressor alleles, its suppression phenotype was tested in all 3 natural yeast isolates, as well as in S288C. a) Example of a suppression interaction that is conserved in all 4 genetic backgrounds. Cultures of 3 independent isolates of the indicated strains were grown until saturation, and a series of 10-fold dilutions was spotted on SD −Ura plates. Plates were incubated at the indicated temperatures for 2 days. Pictures of a representative isolate are shown. b) Quantification of the colony size of the strains in (A). Statistical significance of size differences between gln1-5007 and gln1-5007 lug1Δ strains with the same genetic background was determined using Welch's t-tests. * P < 0.05; ** P < 0.005; *** P < 0.0005; n.s., not significant. c) Summary of suppression conservation results. Shown is the mean fold increase in colony size of strains carrying the suppressor compared with strains without the suppressor. The condition (temperature, plasmid backbone, allele) with the largest change in colony size was used. Spot dilution assays of the suppression assays are shown in Figs. 3 and 4 and Supplementary Figs. 2–4. Summary statistics on the colony size quantification are included in Supplementary Data 5.
Fig. 3.
Fig. 3.
Different levels of SCT1 expression are needed for suppression of SEC17 across genetic backgrounds. a) S288C, L-1374, UWOPS87-2421, and NCYC110 strains carrying the sec17-1 TS allele were transformed with a low-copy (CEN) or a high-copy () plasmid expressing SCT1 or the corresponding empty vector. Cultures of 2–3 independent transformants were grown until saturation, and a series of 10-fold dilutions was spotted on SD −Ura (low-copy) or SD −Leu (high-copy) plates. Plates were incubated at the indicated temperatures for 3 days. Plates were imaged, colony sizes were quantified, and statistical significance of size differences between suppressor candidates and controls was determined using Welch's t-tests. Pictures of a representative transformant are shown for each genotype. Rare, larger colonies that appear at higher temperatures are spontaneous suppressor mutants that sometimes occur during the experiments. b) As in (A) but using the SCT1 alleles from the L-1374, UWOPS87-2421, and NCYC110 backgrounds, rather than the S288C allele. UWOPS , UWOPS87-2421; NCYC , NCYC110; *P < 0.05; **P < 0.005; ***P < 0.0005; n.s., not significant.
Fig. 4.
Fig. 4.
Suppression of SEC17 by SEC22 is dependent on the allele sequence. a) S288C, L-1374, UWOPS87-2421, and NCYC110 strains carrying the sec17-1 TS allele were transformed with a low-copy (CEN4/ARS1) or a high-copy () plasmid expressing SEC22 or the corresponding empty vector. Cultures of 2–3 independent transformants were grown until saturation, and a series of 10-fold dilutions was spotted on SD −Ura (low-copy) or SD −Leu (high-copy) plates. Plates were incubated at the indicated temperatures for 3 days. Plates were imaged, colony sizes were quantified, and statistical significance of size differences between suppressor candidates and corresponding controls was determined using Welch's t-test. Pictures of a representative transformant are shown for each genotype. b) A UWOPS87-2421 strain carrying the sec17-1 TS allele was transformed with a CEN6/ARSH4 plasmid carrying either the S288C or the UWOPS87-2421 version of SEC22, or the corresponding empty vector. Spot dilutions were performed as in (a). c) Expression levels of the indicated genes in wild-type S288C or UWOPS87-2421 strains were determined by RNA sequencing. Plotted are RPKM (reads per kilobase per million mapped reads) values, normalized to the total number of reads in a sample and averaged over 3 technical replicates. Error bars indicate the standard deviation. Statistical significance between strains was determined using 2-sided Student's t-tests. UWOPS, UWOPS87-2421; *P < 0.05; **P < 0.005; ***P < 0.0005; n.s., not significant.
Fig. 5.
Fig. 5.
Multiple genes can contribute to the suppression phenotype. Relative fitness of sec17-1 strains overexpressing SEC18, SEC22, and/or SCT1 in the S288C, L-1374, UWOPS87-2421, and NCYC110 genetic backgrounds. In each case, the SEC18, SEC22, and SCT1 alleles matched the genetic background in which they were transformed, such that S288C was transformed with S288C alleles and L-1374 with L-1374 alleles, etc. Strains were spotted on SD −Leu/Ura/His and colony size was determined after 2 days of growth at 33°C and normalized to the colony size of a wild-type strain with the same genetic background. Boxplots show the normalized colony size (fitness) of, on average, ∼200 colonies per strain. Tukey's test was used to determine whether strains overexpressing 2 or 3 genes had a significantly higher fitness than strains overexpressing one of the genes. +, strains were transformed with the indicated plasmid; −, strains were transformed with the corresponding empty vector. *P < 0.05; **P < 0.005; ***P < 0.0005; n.s., not significant.

Similar articles

References

    1. Anders S, Pyl PT, Huber W. 2015. HTSeq–a python framework to work with high-throughput sequencing data. Bioinformatics. 31(2):166–169. doi:10.1093/bioinformatics/btu638. - DOI - PMC - PubMed
    1. Batte A, Bosch-Guiteras N, Pons C, Ota M, Lopes M, Sharma S, Tellini N, Paltenghi C, Conti M, Kan KT, et al. 2025. The modifiers that cause changes in gene essentiality [preprint]. bioRxiv. doi:10.1101/2025.03.06.641712. - DOI
    1. Beach RR, Ricci-Tam C, Brennan CM, Moomau CA, Hsu PH, Hua B, Silberman RE, Springer M, Amon A. 2017. Aneuploidy causes non-genetic individuality. Cell. 169(2):229–242.e21. doi:10.1016/j.cell.2017.03.021. - DOI - PMC - PubMed
    1. Busby BP, Niktab E, Roberts CA, Sheridan JP, Coorey NV, Senanayake DS, Connor LM, Munkacsi AB, Atkinson PH. 2019. Genetic interaction networks mediate individual statin drug response in Saccharomyces cerevisiae. NPJ Syst Biol Appl. 5(1):35. doi:10.1038/s41540-019-0112-5. - DOI - PMC - PubMed
    1. Carpenter AE, Jones TR, Lamprecht MR, Clarke C, Kang IH, Friman O, Guertin DA, Chang JH, Lindquist RA, Moffat J, et al. 2006. CellProfiler: image analysis software for identifying and quantifying cell phenotypes. Genome Biol. 7(10):R100. doi:10.1186/gb-2006-7-10-r100. - DOI - PMC - PubMed

Substances

LinkOut - more resources