. 2025 Feb 27;53(5):gkaf126.
doi: 10.1093/nar/gkaf126.

Systematic analysis of specificities and flanking sequence preferences of bacterial DNA-(cytosine C5)-methyltransferases reveals mechanisms of enzyme- and sequence-specific DNA readout

Affiliations

Systematic analysis of specificities and flanking sequence preferences of bacterial DNA-(cytosine C5)-methyltransferases reveals mechanisms of enzyme- and sequence-specific DNA readout

Greta Sogl et al. Nucleic Acids Res. .

Abstract

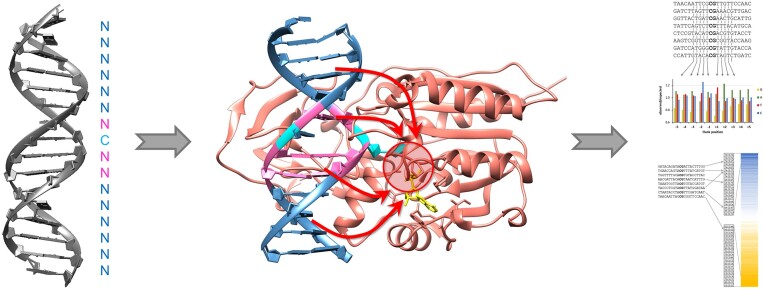
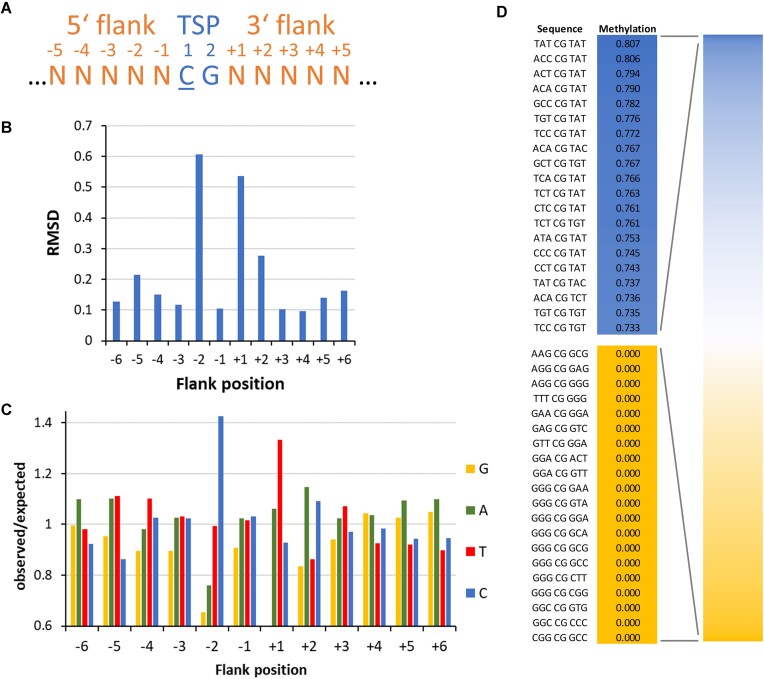
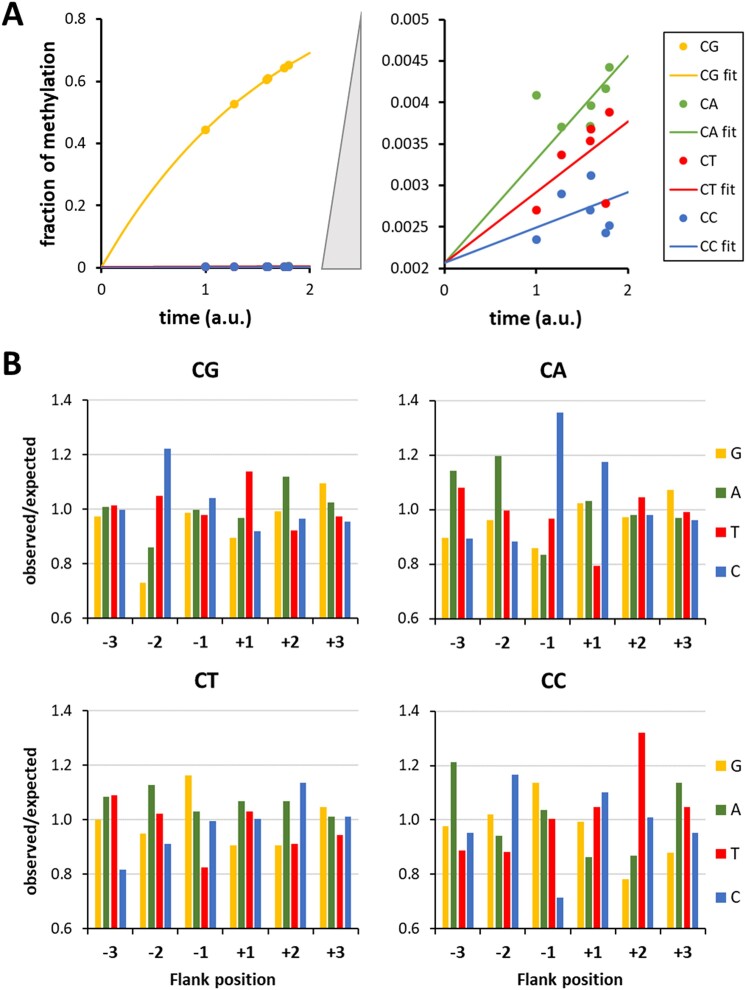
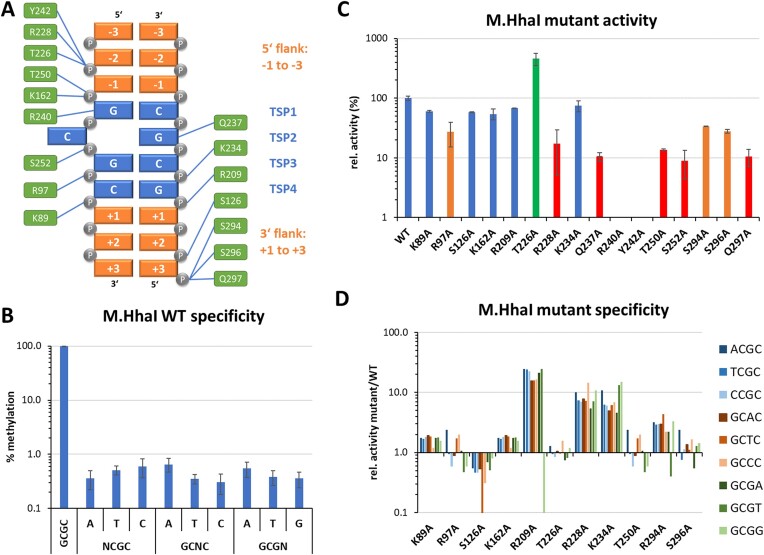
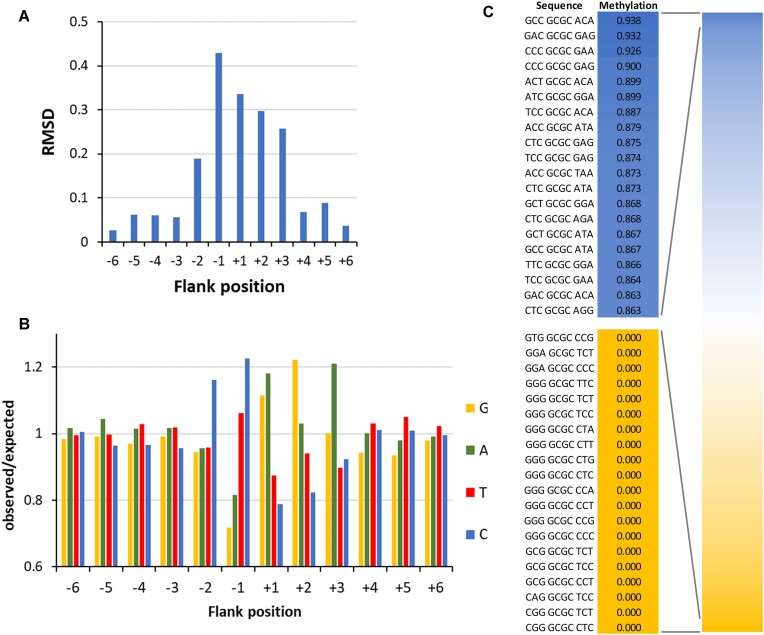
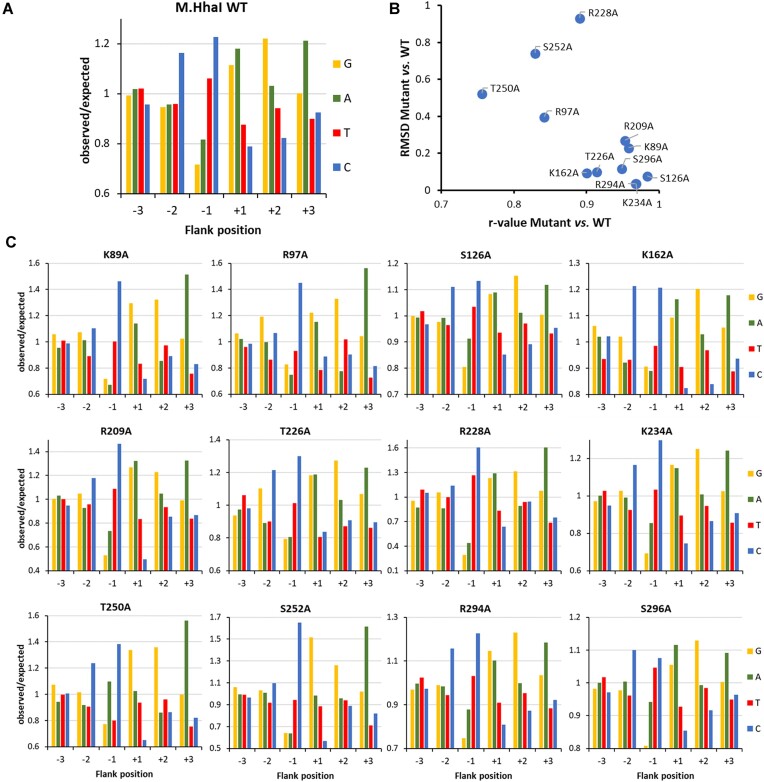
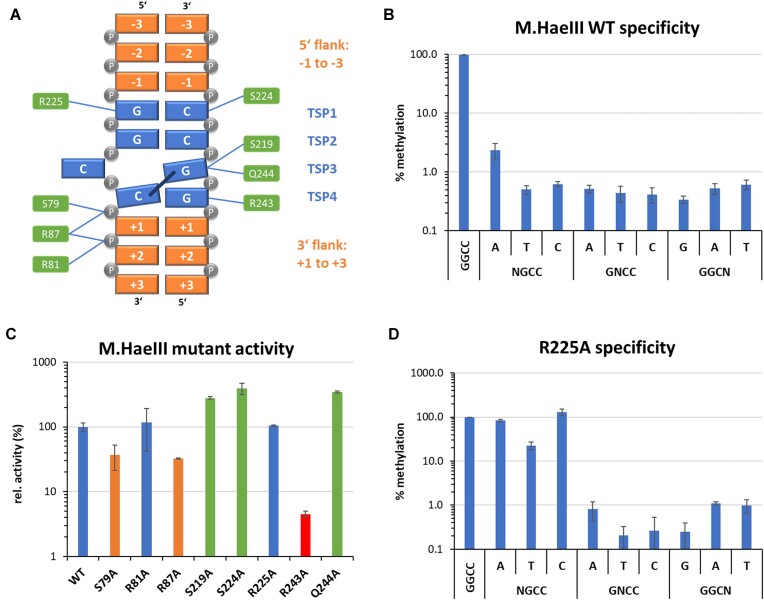
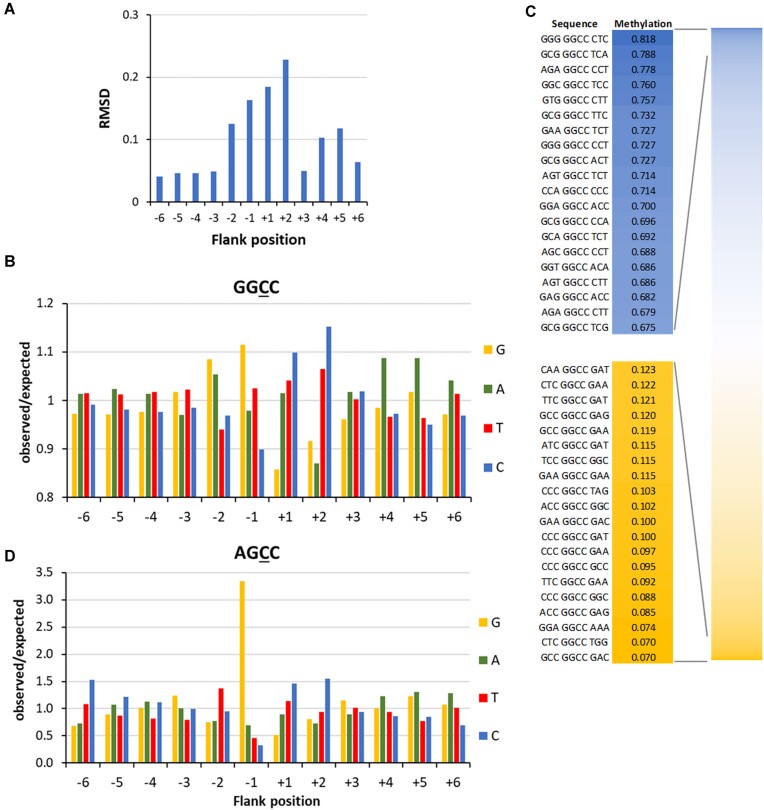
DNA-(cytosine C5)-methyltransferases (MTases) represent a large group of evolutionary related enzymes with specific DNA interaction. We systematically investigated the specificity and flanking sequence preferences of six bacterial enzymes of this class and many MTase mutants. We observed high (>1000-fold) target sequence specificity reflecting strong evolutionary pressure against unspecific DNA methylation. Strong flanking sequence preferences (∼100-fold) were observed which changed for methylation of near-cognate sites suggesting that the DNA structures in the transition states of the methylation of these sites differ. Mutation of amino acids involved in DNA contacts led to local changes of specificity and flanking sequence preferences, but also global effects indicating that larger conformational changes occur upon transition state formation. Based on these findings, we conclude that the transition state of the DNA methylation reaction precedes the covalent enzyme-DNA complex conformations with flipped target base that are resolved in structural studies. Moreover, our data suggest that alternative catalytically active conformations exist whose occupancy is modulated by enzyme-DNA contacts. Sequence dependent DNA shape analyses suggest that MTase flanking sequence preferences are caused by flanking sequence dependent modulation of the DNA conformation. Likely, many of these findings are transferable to other DNA MTases and DNA interacting proteins.


Conflict of interest statement

None declared.

Figures

Graphical Abstract
Graphical Abstract
Figure 1.
Figure 1.
Flanking sequence preferences of M.SssI in CpG methylation determined with a substrate library containing a CG site in randomized sequence context. (A) Scheme of the sequence numbering and designations used in this work. TSP, target site position. (B) Magnitude of the flanking sequence preferences in CpG methylation at the −6 to +6 flank positions. Enrichment and depletion of bases at the positions in methylated substrate molecules were determined and the position-specific effect size plotted. Also see Supplementary Fig. S4B. (C) Enrichment and depletion of bases at the positions in methylated substrate molecules were determined and plotted as o/e frequencies. (D) Average methylation levels of NNNCGNNN bins.
Figure 2.
Figure 2.
CpG specificity of M.SssI determined with substrate library containing a CN site in a randomized sequence context. (A) Average methylation of CpG, CpA, CpT, and CpC sites in the different experiments fitted to an exponential reaction progress curve. Also see Supplementary Fig. S4C. (B) Flanking sequence preferences of M.SssI in CpG and non-CpG methylation. Shown are the enrichment and depletion of bases at the −2 to +2 flank positions in substrate molecules methylated at CpG, CpA, CpT, and CpC sites. Also see Supplementary Fig. S4C.
Figure 3.
Figure 3.
Specificity of M.HhaI WT and mutants. (A) Scheme of the sequence numbering and designations used in this work and the M.HhaI-DNA contacts analyzed by mutations. TSP, target site position. (B) Specificity of WT M.HhaI for GCGC methylation determined with the substrate library containing a CN site in randomized sequence context. Average methylation of GCGC and all near-cognate sites was determined. Error bars display the standard deviation (SD) of the independent experiments. Also see Supplementary Figs S6A and S7. (C) Activity of the M.HhaI mutants determined using a substrate library containing a GCGC site in a randomized sequence context by the radioactive DNA methylation assay. Error bars display SD of at least three experimental repeats. (D) Specificity of M.HhaI mutants for methylation of GCGC or near-cognate sites determined with the substrate library containing a CN site in randomized sequence context. Supplementary Fig. S7 shows the near-cognate site activity of the mutant relative to the GCGC activity divided by the corresponding value of the WT.
Figure 4.
Figure 4.
Flanking sequence preferences of M.HhaI determined with the substrate library containing a GCGC site in randomized sequence context. (A) Magnitude of the flanking sequence preferences for GCGC methylation at the −6 to +6 flank positions. Enrichment and depletion of bases at the positions in methylated substrate molecules were determined and the position-specific effect size plotted. Also see Supplementary Fig. S6B. (B) Enrichment and depletion of bases at the −6 to +6 flank positions in methylated substrate molecules were determined and plotted as o/e frequencies. (C) Average methylation levels of NNNGCGCNNN bins.
Figure 5.
Figure 5.
Flanking sequence preferences of M.HhaI mutants determined with the substrate library containing a GCGC site in randomized sequence context. (A) Sequence preferences of WT M.HhaI at the −3 to +3 flank positions plotted as o/e frequencies. Taken from Fig. 4B for comparison. (B) Quantitative differences of the −6 to +6 flanking sequence preferences of M.HhaI mutants versus WT expressed as Pearson correlation (r-value) and RMSD. (C) Flanking sequence preferences of M.HhaI mutants at the −3 to +3 flank positions plotted as o/e frequencies.
Figure 6.
Figure 6.
Specificity of M.HaeIII WT and mutants. (A) Scheme of the sequence numbering and designations used in this work and the M.HaeIII–DNA contacts analyzed by mutations. TSP, target site position. (B) Specificity of WT M.HaeIII in GGCC methylation determined with the substrate library containing a CN site in randomized sequence context. Average methylation of GGCC and all near-cognate sites was determined. Error bars display the SD of the independent experiments. Also see Supplementary Fig. S8A. (C) Activity of the M.HaeIII mutants determined using the substrate library containing a GGCC site in randomized sequence context by the radioactive DNA methylation assay. Error bars display SD of at least three experimental repeats. (D) Specificity of the M.HaeIII R225A mutant shown as described in panel (B). Also see Supplementary Fig. S8C for the specificities of the other M.HaeIII mutants.
Figure 7.
Figure 7.
Flanking sequence preferences of M.HaeIII. (A) Magnitude of the flanking sequence preferences for GGCC methylation at the −6 to +6 flank positions. Enrichment and depletion of bases at the positions in methylated substrate molecules were determined and the position-specific effect size plotted. Also see Supplementary Fig. S8B. (B) Enrichment and depletion of bases at the −6 to +6 flank positions in methylated substrate molecules were determined and plotted as o/e frequencies. (C) Average methylation levels of NNNGGCCNNN bins. (D) Flanking sequence preferences of M.HaeIII for methylation in AGCC context, taken from the methylation data obtained with the substrate library containing a CN site in randomized sequence context.
Figure 8.
Figure 8.
Flanking sequence preferences of M.HaeIII mutants determined using the substrate library containing a GGCC site in randomized sequence context. (A) Sequence preferences of WT M.HaeIII at the −3 to +3 flank positions plotted as o/e frequencies. Taken from Fig. 7B for comparison. (B) Quantitative differences of the −6 to +6 flanking sequence preferences of M.HaeIII mutants versus WT expressed as Pearson correlation (r-value) and RMSD. (C) Flanking sequence preferences of M.HaeIII mutants at the −3 to +3 flank positions plotted as o/e frequencies.
Figure 9.
Figure 9.
Flanking sequence preference and specificity data of M.HpaII, M.MspI, and M.AluI. (A–C) Flanking sequence preferences of M.HpaII, M.MspI, and M.AluI determined by methylation of pools of DNA molecules containing a CCGG or AGCT site in randomized sequence context. Enrichment and depletion of bases at the −6 to +6 flank positions in methylated substrate molecules were determined and plotted as o/e frequencies. Also see Supplementary Figs S9 and S10. (D–F) Specificities of M.HpaII, M.MspI, and M.AluI for methylation of their target motifs determined with the pool of DNA molecules containing a CN site in randomized sequence context. Average methylation of the corresponding target sites and all near-cognate sites were determined. Error bars display the SD of the independent experiments.
Figure 10.
Figure 10.
Correlation of flanking sequence preferences and flanking sequences dependence of DNA shape parameters. Enzyme activities were calculated for all N4XN4 sequences (where X denotes the specific recognition sequence of each enzyme). DNA shape parameters were predicted for the same sequences using the Deep DNAshape server (https://deepdnashape.usc.edu/) [51, 52] and both data sets were correlated. The figure shows the pairwise Pearson r-values, the color code is provided at the bottom. The shape properties are explained in Supplementary Fig. S1.
Figure 11.
Figure 11.
Examples of the correlation of individual shape preferences with the intrinsic DNA shape parameters of the enzyme’s target sequence. The individual shape preferences of enzymes are expressed as the correlation of individual shape properties with enzyme activity (r-value) on the left axis. The r-values of all correlations are provided in Fig. 10. The intrinsic DNA shape parameters of the target sequence are expressed in property dependent units on the right axis. All intrinsic shape analyses are provided in Supplementary Fig. S11.

Similar articles

References

    1. Sanchez-Romero MA, Casadesus J The bacterial epigenome. Nat Rev Micro. 2020; 18:7–20.10.1038/s41579-019-0286-2. - DOI - PubMed
    1. Sanchez-Romero MA, Cota I, Casadesus J DNA methylation in bacteria: from the methyl group to the methylome. Curr Opin Microbiol. 2015; 25:9–16.10.1016/j.mib.2015.03.004. - DOI - PubMed
    1. Jeltsch A Beyond Watson and Crick: DNA methylation and molecular enzymology of DNA methyltransferases. ChemBioChem. 2002; 3:274–93.10.1002/1439-7633(20020402)3:4<274::AID-CBIC274>3.0.CO;2-S. - DOI - PubMed
    1. Roberts RJ, Vincze T, Posfai J et al. . REBASE: A database for DNA restriction and modification: enzymes, genes and genomes. Nucleic Acids Res. 2023; 51:D629–30.10.1093/nar/gkac975. - DOI - PMC - PubMed
    1. Lauster R Evolution of type II DNA methyltransferases. A gene duplication model. J Mol Biol. 1989; 206:313–21.10.1016/0022-2836(89)90481-6. - DOI - PubMed

MeSH terms

LinkOut - more resources