. 2025 Feb 27;53(5):gkaf139.
doi: 10.1093/nar/gkaf139.

Quantification of subcellular RNA localization through direct detection of RNA oxidation

Affiliations

Quantification of subcellular RNA localization through direct detection of RNA oxidation

Hei-Yong G Lo et al. Nucleic Acids Res. .

Abstract

Across cell types and organisms, thousands of RNAs display asymmetric subcellular distributions. Studying this process requires quantifying abundances of specific RNAs at precise subcellular locations. To analyze subcellular transcriptomes, multiple proximity-based techniques have been developed in which RNAs near a localized bait protein are specifically labeled, facilitating their biotinylation and purification. However, these complex methods are often laborious and require expensive enrichment reagents. To streamline the analysis of localized RNA populations, we developed Oxidation-Induced Nucleotide Conversion sequencing (OINC-seq). In OINC-seq, RNAs near a genetically encoded, localized bait protein are specifically oxidized in a photo-controllable manner. These oxidation events are then directly detected and quantified using high-throughput sequencing and our software package, PIGPEN, without the need for biotin-mediated enrichment. We demonstrate that OINC-seq can induce and quantify RNA oxidation with high specificity in a dose- and light-dependent manner. We further show the spatial specificity of OINC-seq by using it to quantify subcellular transcriptomes associated with the cytoplasm, ER, nucleus, and the inner and outer membranes of mitochondria. Finally, using transgenic zebrafish, we demonstrate that OINC-seq allows proximity-mediated RNA labeling in live animals. In sum, OINC-seq together with PIGPEN provide an accessible workflow for analyzing localized RNAs across different biological systems.


Conflict of interest statement

None declared.

Figures

Graphical Abstract
Graphical Abstract
Figure 1.
Figure 1.
OINC-seq detects oxidized RNA by quantifying RT errors induced by guanosine oxidation. (A) Schematic showing the oxidative products of guanosine. (B) Schematic of an OINC-seq experiment. Guanosine oxidation, induced by proximity-mediated labeling, results in RT misincorporation events. These events are read out using high-throughput sequencing as G to T mutations, G to C mutations, and G deletions relative to a reference sequence. (C) Immunofluorescence detection of 8OG in HeLa cells expressing a cytoplasmic p65 Halo fusion protein with (+Halo-DBF) or without labeling (-Halo-DBF). Scale bars 8 μm. (D) Frequency of nucleotide conversions (orange) and deletions (red) in an RT-PCR product of a synthesized RNA oligonucleotide containing a control guanosine residue at position 16 (top), a single 8OG residue at position 16 (middle) or a single GH residue at position 16 (bottom). (E) Proportion of nucleotide content of RT-PCR products at position 16 across all reads for the control oligonucleotide, 8OG-containing oligonucleotide, or GH-containing oligonucleotide.
Figure 2.
Figure 2.
PIGPEN detects nucleotide conversions in RNAseq data and quantifies proximity-induced RNA oxidation events in OINC-seq experiments. (A) Schematic of PIGPEN workflow. (B-D) Proximity-mediated RNA oxidation was induced using a cytoplasmically localized HaloTag protein and increasing amounts of the oxygen radical-producing Halo-DBF ligand. Relative conversion rates in an RT-PCR amplicon of the GAPDH transcript were calculated and compared to samples in which Halo-DBF was omitted (n = 3). Multiple analyses were performed with varying PIGPEN parameters, including whether one G conversion was required to be found in a single read of a mate pair (B), one conversion was required in both reads of a mate pair (C), or two conversions were required per read (D). (E) Proximity-mediated RNA oxidation was induced using a cytoplasmically localized HaloTag protein and 5 μM Halo-DBF. Samples were then irradiated with green light for increasing amounts of time. Nucleotide conversion rates were then calculated using PIGPEN and compared to samples in which Halo-DBF was omitted. In this analysis, only one G conversion was required, and conversions were required to be found in both mates of a read pair.
Figure 3.
Figure 3.
OINC-Seq labels RNA in a spatially specific manner. (A) HaloTag fusions to H2B (top) and p65 (bottom) are nuclearly and cytoplasmically localized, respectively. HaloTag fusions are visualized using a fluorescent Halo ligand, JF549 (magenta). Scale bars 8 μm. (B) Relative nucleotide conversion rates between Halo-DBF treated and untreated samples (n = 4). Results are shown for RT-PCR amplicons of MALAT1 (top) and GAPDH (bottom) in cells expressing either Halo-H2B or Halo-p65. In this analysis, conversions were required to be seen in both reads of a mate pair, and reads were required to have at least two G conversions. (C) Relative enrichment of G conversions in Halo-H2B samples compared to Halo-p65 samples. (D) Relative enrichment of G conversions in Halo-H2B samples compared to Halo-p65 samples for a non-intron-spanning (left) and intron-spanning (right) amplicon of GAPDH.
Figure 4.
Figure 4.
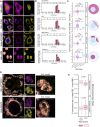
OINC-seq identifies subcellular localized RNAs on a transcriptomic scale. (A) Representative fluorescent images of HaloTag fusion proteins co-localized with proteins at the region of interest. HaloTag fusion proteins are visualized by the Halo ligand JF549 (magenta). Top: Halo-p65. Top-Middle: ER-localized HaloTag fusion Halo-P450 colocalizing with a known ER marker GRP94 (yellow). Bottom-Middle: mitochondrial matrix HaloTag fusion Halo-ATP5MC1 colocalizing with the mitochondrial protein TOM20 (yellow). Bottom: H2B HaloTag fusion Halo-H2B colocalizing with DAPI (yellow). Scale bar 8 μm. (B) Bulk relative conversion rates comparing Halo-DBF treated and untreated samples (n = 3) for all four labeled subcellular compartments. (C) G conversion rates of four different classes of RNAs (ER-localized, Mitochondria, Nuclear, Other) in OINC-seq experiments using cytoplasmically, ER-, mitochondrially, and nuclearly localized HaloTag fusions. Wilcox rank-sum tests were used to compare across RNA classes (ns represents P > 0.05, ** P < 0.01, **** P < 0.0001). (D) Representative fluorescent images of mitochondrial-localized HaloTag fusions Halo-ATP5MC1 and Halo-MAVS using SIM. Top: the mitochondrial matrix Halo fusion (Halo-ATP5MC1) co-stained with the mitochondrial membrane marker MitoView. Bottom: the outer mitochondrial membrane Halo fusion (Halo-MAVS) co-stained with the mitochondrial membrane marker MitoView. Scale bar 5 μm. Insets allow better appreciation of the relative position of each stained structure. Scale bar 1 μm (insets). (E) G conversion rates for two classes of RNA that encode mitochondrial proteins, those encoded on the mitochondrial chromosome and those encoded in the nuclear genome. Rates are shown for OINC-seq experiments using the mitochondrial matrix HaloTag fusion (Halo-ATP5MC1) and the outer mitochondrial membrane HaloTag fusion (Halo-MAVS) (n = 3). Wilcox rank-sum tests were used to compare across RNA classes.
Figure 5.
Figure 5.
OINC-seq is compatible with RNA labeling in live animals. (A) Representative images of 2 days post-fertilization (dpf) homozygous bact2:Halo-NES transgenic zebrafish (top), bact2:Halo-H2B transgenic zebrafish (middle) or wild-type zebrafish embryo (bottom) stained with the fluorescent Halo ligand JF646 (magenta). Anterior to the left, scale bar 200 μm. (B) Confocal imaging of epithelial cells in homozygous bact2:Halo-NES (top), bact2:Halo-H2B (middle) or non-transgenic wild type (bottom). A single cell is highlighted by outlines. The HaloTag-NES fusion, visualized using JF646 (magenta), is excluded from the nucleus while the HaloTag–H2B fusion is localized to the nucleus. (C) Bulk relative conversion rates comparing Halo-DBF-treated and untreated samples for wild type (cross-hatch, n = 3) and bact2:Halo-NES (solid, n = 2) zebrafish following OINC-seq at 2 dpf. (D) Relative enrichment of G conversions in malat1 and gapdh RT-PCR amplicons in HaloTag-H2B samples compared to HaloTag-NES samples.

Update of

References

    1. Long RM, Singer RH, Meng X et al. . Mating type switching in yeast controlled by asymmetric localization of ASH1 mRNA. Cell Rep. 1997; 277:1256–64.10.1126/science.277.5324.383. - DOI - PubMed
    1. Lécuyer E, Yoshida H, Parthasarathy N et al. . Global analysis of mRNA localization reveals a prominent role in organizing cellular architecture and function. Cell. 2007; 131:174–87.10.1016/j.cell.2007.08.003. - DOI - PubMed
    1. Moor AE, Golan M, Massasa EE et al. . Global mRNA polarization regulates translation efficiency in the intestinal epithelium. Science. 2017; 357:1299–1303.10.1126/science.aan2399. - DOI - PMC - PubMed
    1. Cajigas IJ, Tushev G, Will TJ et al. . The local transcriptome in the synaptic neuropil revealed by deep sequencing and high-resolution imaging. Neuron. 2012; 74:453–66.10.1016/j.neuron.2012.02.036. - DOI - PMC - PubMed
    1. Engel KL, Arora A, Goering R et al. . Mechanisms and consequences of subcellular RNA localization across diverse cell types. Traffic. 2020; 21:404–18.10.1111/tra.12730. - DOI - PMC - PubMed