. 2025 Mar 4;16(1):153.
doi: 10.1038/s41419-025-07473-8.

Circulating mitochondrial DNA promotes M2 polarization of tumor associated macrophages and HCC resistance to sorafenib

Affiliations

Circulating mitochondrial DNA promotes M2 polarization of tumor associated macrophages and HCC resistance to sorafenib

Qi Yang et al. Cell Death Dis. .

Abstract

Mitochondrial damage-associated molecular patterns (DAMPs) including mitochondrial DNA (mtDNA), TFAM (transcription factor A, mitochondrial), and ATP, which play crucial roles in the regulation of inflammatory environment in human diseases. However, the role of mitochondrial DAMPs in regulating tumor microenvironment (TME) remains unclear. Herein, we demonstrate that infiltration of M2-type tumor-associated macrophages (TAMs) was correlated with the resistance of hepatocellular carcinoma (HCC) to sorafenib. We found that cell-free mtDNA in the plasma was significantly increased in sorafenib-resistant HCC mice. Sorafenib induced mitochondrial dysfunction and promoted the release of mtDNA into extracellular matrix of HCC. Macrophages retook the mtDNA in the TME of HCC, activated TLR9 signaling, and promoted the activation of NF-κB and the polarization of TAMs into M2. Application of DNase I to digest mtDNA or depletion of macrophages with clodronate liposomes reduced M2 macrophage infiltration, decreased the growth of HCC, and sensitized the tumors to sorafenib. Furthermore, we showed that blocking the activation of TLR9 enhanced the therapeutic effect of sorafenib in HCC. Together, we demonstrate that sorafenib treatment leads to the release of mtDNA into TME in HCC, which in turn facilitates the polarization of TAMs into M2 macrophages through TLR9 activation and aggravates the resistance of HCC to sorafenib. Our study reveals a novel mechanism underlying circulating mtDAMPs in remodeling the HCC microenvironment by reprograming the TAMs and provides a new strategy for improving the therapeutic effect of sorafenib and overcoming its resistance in HCC.


Conflict of interest statement

Competing interests: All authors declare no competing interests. Ethics approval and consent to participate: This study was approved by the Ethics Committee of Henan University, and the informed consents were signed by all participants. Animal study was approved by the Institutional Animal Care and Use Committee of Henan University. We confirmed that all methods were performed in accordance with the relevant guidelines and regulations of the Ethics Committee of Henan University and Institutional Animal Care and Use Committee of Henan University. Consent for publication: Consent to publish has been obtained from all authors.

Figures

Fig. 1
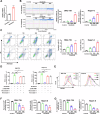
Fig. 1. M2-TAMs infiltration is correlated with HCC resistance to sorafenib.
A CD163 expression in patients which responder or non-responder to sorafenib from the GSE109211 datasets. B Schematic description of sorafenib treatment in the mouse orthotopic HCC model (n = 6). C Representative images of orthotopic tumors and H&E staining in representative group (n = 6). D The ratio of mouse liver tumors to liver area in indicated groups (n = 6). E qRT-PCR analysis for the mRNA expression levels of MRC1 and ARG1 in indicated groups. F Western blotting analysis for the expression levels of CD206 in indicated groups. G, H Immunohistochemical (IHC) (G) and immunofluorescence (IF) (H) analysis for the expression levels of CD206 in representative groups. I Representative images and tumor growth curves of subcutaneous xenograft tumor model developed from HCC cells treatment with indication (n = 6). J–L The sensitivity of HCC cells (SNU739 and Hepa1-6 cells) incubated with M2-CM to sorafenib was determined by cell viability (J), cell proliferation (K), and caspase 3/7 activity assays (L). M2-CM, Conditioned medium from IL-4 and IL-13 induced M2 macrophages. ***P < 0.001.
Fig. 2
Fig. 2. Conditioned medium from Sorafenib-treated HCC cells promotes M2 polarization of TAMs.
A Flow cytometry analysis of M2-TAM percentage in THP-1-derived macrophages treated with CM from HCC cells. B mRNA content of M2-TAM-associated cytokines in THP-1-derived macrophages and RAW264.7 cells treated with CM from HCC cells. C Immunofluorescence (IF) analysis of CD163 and CD206 in THP-1-derived macrophages and RAW264.7 cells treated with CM from HCC cells. D Flow cytometry analysis of M1-TAM contents in THP-1-derived macrophages treated with CM from HCC cells. E qRT-PCR analysis of CD86 and IL6 in THP-1-derived macrophages and RAW264.7 cells treated with CM from HCC cells. F qRT-PCR analysis for the mRNA expression of IL10, CCL2, CCL22 and VEGF in THP-1-derived macrophages and RAW264.7 which were treated with CM from HCC cells as indicated. G Transwell migration assay of THP-1-derived macrophages and RAW264.7 by CM from HCC cells as indicated. CM, Conditioned medium; SOR, Sorafenib. **P < 0.01; ***P < 0.001.
Fig. 3
Fig. 3. Sorafenib promotes extracellular release of mitochondrial DNA from HCC cells by induction of apoptosis.
A Relative mtDNA content in plasma from HCC orthotopic mouse model was detected by qPCR. B Cell free mtDNA content in supernatant of HCC cells treatment with sorafenib was quantitated via ddPCR. C The apoptosis level of HCC cells treated as indicated were detected by flow cytometry. D Relative mtDNA content in the supernatant of HCC cells treated with inhibitors of apoptosis, necroptosis and ferroptosis. E ROS in HCC cells were detected by flow cytometry. F, G The ATP levels (F) and mitochondrial membrane potential (G) of HCC cells treated as indicated were determined using a commercial kit. *P < 0.05; **P < 0.01; ***P < 0.001.
Fig. 4
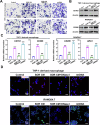
Fig. 4. Mitochondrial DNA promotes M2 polarization of TAMs.
A Transwell migration assay of THP-1-derived macrophages and RAW264.7 treated as indicated. B, C Western blot (B) and qRT-PCR (C) analysis the expression levels of M2-TAM marker in THP-1-derived macrophages and RAW264.7 treated as indicated. D Immunofluorescence (IF) analysis the expression levels of CD163 and CD206 in THP-1-derived macrophages and RAW264.7 treated as indicated. SOR CM, Conditioned medium from HCC cells treated with sorafenib. ***P < 0.001 versus control group; ##P < 0.01; ###P < 0.001 versus SOR CM treated group.
Fig. 5
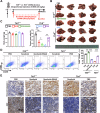
Fig. 5. Mitochondrial DNA promotes M2 polarization of TAMs and HCC proliferation in mice.
A Representative images of orthotopic HCC tissues treated as indicated (n = 6). B The ratio of mouse liver tumors to liver area was detected in individuals of A (n = 6). C qRT-PCR analysis of the expression levels of CD206 in orthotopic HCC tissues treated as indicated (n = 6). D Representative H&E staining (upper) and CD206 immunohistochemistry (under) images of orthotopic HCC tissues treated as indicated. Scale bar: 100 μm. E The percentage of CD206 positive macrophage in orthotopic HCC tissues was investigated by flow cytometry (n = 6). mtDNA, mice were injected with mtDNA. DNase I, mice were injected with mtDNA and DNase I. Clodronate, mice were injected mtDNA and with clodronate. F Western blot analysis of CD206 in orthotopic HCC tissues in mice treated as indicated. *P < 0.05; **P < 0.01 versus control group; ##P < 0.01; ###P < 0.001 versus mtDNA treated group.
Fig. 6
Fig. 6. Mitochondrial DNA promotes M2 polarization of TAMs through activating TLR9.
A Differential mRNA expression in RNA sequencing data of mtDNA-induced M2 macrophages. B Heatmap analysis the expression of marker for M1/M2 macrophages in mtDNA induced M2 macrophages. C KEGG pathway enrichment analyses of differentially expressed genes were performed. D Western blot analysis the related protein expression levels of TLR9 pathway in THP-1-derived macrophages and RAW264.7 treated as indicated. E Immunofluorescence staining of TLR9 and CD163 in tumor tissues from patients with HCC. Scale bar: 100 μm. F, G CIBERSORT analysis the correlated between TLR9 expression and M2 macrophage infiltration level (F) or CD163 expression level (G). H Relative mtDNA content in THP-1-derived macrophages and RAW264.7 treated as indicated was detected by qPCR. I Co-localization analyses between mtDNA and TLR9 in indicated THP-1-derived macrophages and RAW264.7 cells by confocal microscopy. Scale bar: 30 μm.
Fig. 7
Fig. 7. Inhibition of TLR9 pathway reverses mtDNA-mediated M2 polarization of TAMs.
A Immunofluorescence (IF) analysis the expression levels of CD163 in THP-1-derived macrophages treated as indicated. B Western blot analysis the expression levels of CD163 and TLR9 pathway-related protein in THP-1-derived macrophages treated as indicated. C Flow cytometry analysis the percentage of CD163+ cells in THP-1-derived macrophages. D The percentage of CD163+ macrophage in C was statistical analysis, (n = 3). E qRT-PCR analysis of CD163+ in THP-1-derived macrophages treated as indicated. F The percentage of F4/80+/CD206+ macrophage in Fig. S9B was statistical analysis. (n = 3). G qRT-PCR analysis the expression levels of M2-TAM marker in THP-1-derived macrophages and RAW264.7 treated as indicated. ***P < 0.001 versus control group; ###P < 0.001 versus mtDNA treated group. Con, M0 macrophage; NC, M0 macrophage treated with mtDNA; shTLR9, M0 macrophage treated with mtDNA and shTLR9; ODN-18, M0 macrophage treated with mtDNA and ODN INH-18.
Fig. 8
Fig. 8. Blocking TLR9 pathway enhances the therapeutic effect of sorafenib in HCC.
A Schematic description of sorafenib and E6446 treatment in the DEN-induced HCC model (n = 4). B Representative micrographs of DEN-induced HCC treated as indicated (n = 4). C Body weight and the ratio of mouse liver tumors to liver area were detected in individuals of B (n = 4). D Flow cytometry analysis the macrophage infiltration in the DEN-induced HCC tissues treated as indicated (n = 4). E Representative immunohistochemical image of cleaved caspase-3 and Ki-67 in the DEN-induced HCC tissues treated as indicated, Scale bar: 100 μm.
Fig. 9
Fig. 9
Schematic depicting the mitochondrial DNA promotes M2 polarization of tumor associated macrophages and HCC resistance to sorafenib through TLR9 pathway.

References

    1. Chen W, Zheng R, Baade PD, Zhang S, Zeng H, Bray F, et al. Cancer statistics in China, 2015. CA Cancer J Clin. 2016;66:115–32. - PubMed
    1. Siegel RL, Miller KD, Jemal A. Cancer statistics, 2016. CA Cancer J Clin. 2016;66:7–30. - PubMed
    1. Bray F, Ferlay J, Soerjomataram I, Siegel RL, Torre LA, Jemal A. Global cancer statistics 2018: GLOBOCAN estimates of incidence and mortality worldwide for 36 cancers in 185 countries. CA Cancer J Clin. 2018;68:394–424. - PubMed
    1. Llovet JM, Castet F, Heikenwalder M, Maini MK, Mazzaferro V, Pinato DJ, et al. Immunotherapies for hepatocellular carcinoma. Nat Rev Clin Oncol. 2022;19:151–72. - PubMed
    1. Vogel A, Meyer T, Sapisochin G, Salem R, Saborowski A. Hepatocellular carcinoma. Lancet. 2022;400:1345–62. - PubMed

MeSH terms

LinkOut - more resources