. 2025 Mar 5;10(1):79.
doi: 10.1038/s41392-025-02159-1.

Gut dysbiosis conveys psychological stress to activate LRP5/β-catenin pathway promoting cancer stemness

Affiliations

Gut dysbiosis conveys psychological stress to activate LRP5/β-catenin pathway promoting cancer stemness

Bai Cui et al. Signal Transduct Target Ther. .

Abstract

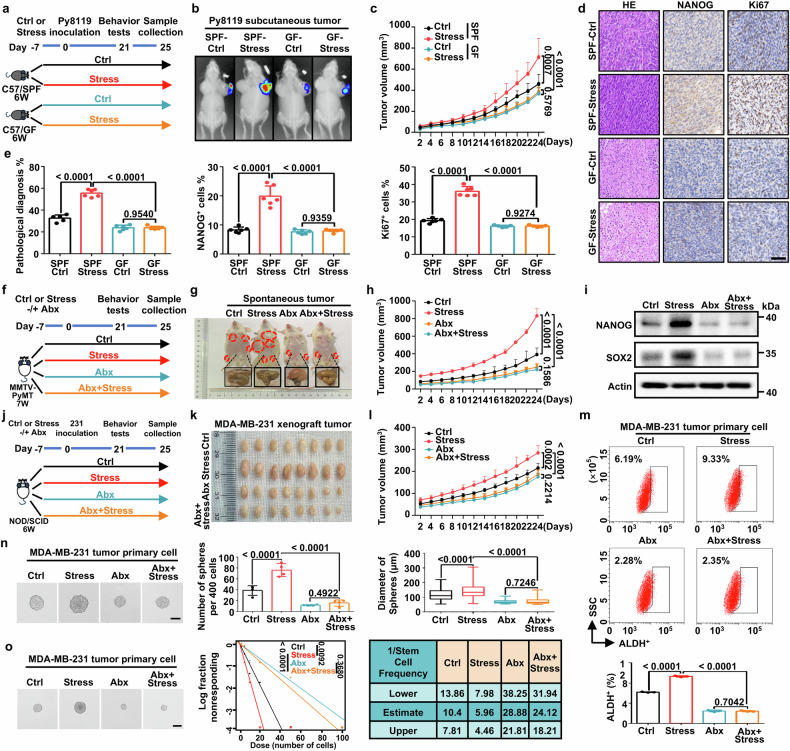
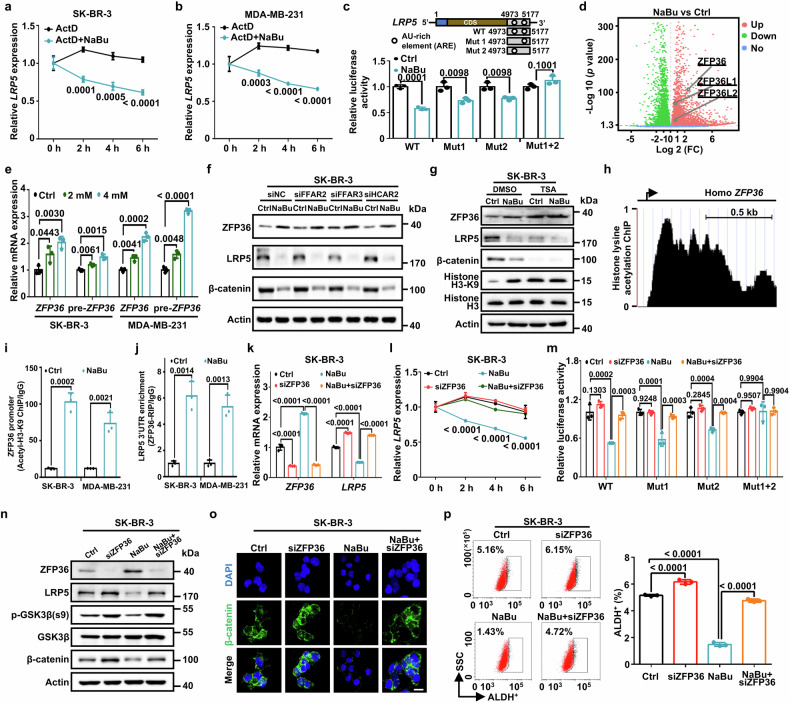
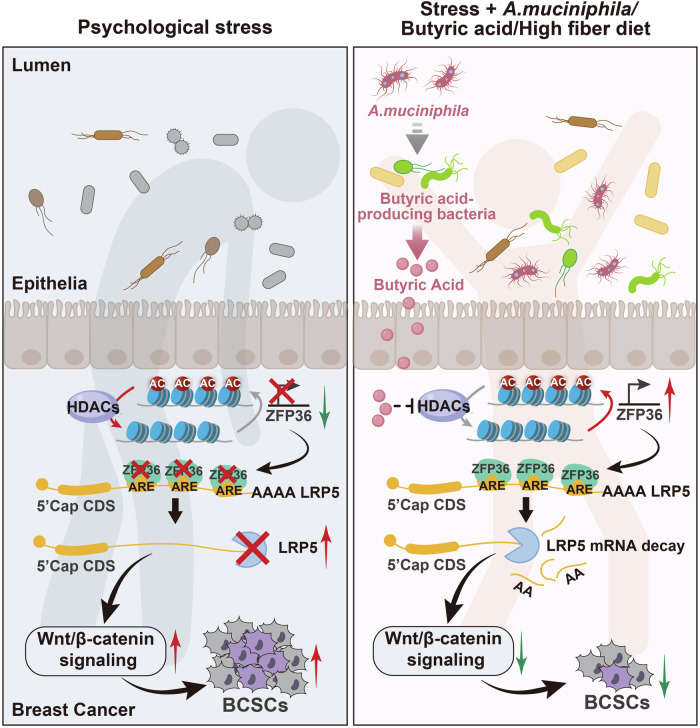
Psychological stress causes gut microbial dysbiosis and cancer progression, yet how gut microbiota determines psychological stress-induced tumor development remains unclear. Here we showed that psychological stress promotes breast tumor growth and cancer stemness, an outcome that depends on gut microbiota in germ-free and antibiotic-treated mice. Metagenomic and metabolomic analyses revealed that psychological stress markedly alters the composition and abundance of gut microbiota, especially Akkermansia muciniphila (A. muciniphila), and decreases short-chain fatty acid butyrate. Supplement of active A. muciniphila, butyrate or a butyrate-producing high fiber diet dramatically reversed the oncogenic property and anxiety-like behavior of psychological stress in a murine spontaneous tumor model or an orthotopic tumor model. Mechanistically, RNA sequencing analysis screened out that butyrate decreases LRP5 expression to block the activation of Wnt/β-catenin signaling pathway, dampening breast cancer stemness. Moreover, butyrate as a HDAC inhibitor elevated histone H3K9 acetylation level to transcriptionally activate ZFP36, which further accelerates LRP5 mRNA decay by binding adenine uridine-rich (AU-rich) elements of LRP5 transcript. Clinically, fecal A. muciniphila and serum butyrate were inversely correlated with tumoral LRP5/β-catenin expression, poor prognosis and negative mood in breast cancer patients. Altogether, our findings uncover a microbiota-dependent mechanism of psychological stress-triggered cancer stemness, and provide both clinical biomarkers and potential therapeutic avenues for cancer patients undergoing psychological stress.


Conflict of interest statement

Competing interests: All authors declare no competing interests.

Figures

Fig. 1
Fig. 1
Gut microbiota is required for psychological stress-induced breast cancer progression and stemness. a Schematic of specific pathogen-free (SPF) and germ-free (GF) mice that were stressed (Stress) or served as control (Ctrl) (n = 10 mice per group). The stress group was exposed to chronic restraint stress for 7 days before inoculation with Py8119-pLVX-MCS-Luc2 or PY8119 cells, and Ctrl group was inoculated with Py8119-pLVX-MCS-Luc2 or PY8119 cells without stress exposure. b Representative bioluminescence images of Py8119-pLVX-MCS-Luc2 subcutaneous tumors in SPF and GF mice that were stressed or served as Ctrl. c Tumor volume curves in SPF/GF C57BL/6 J Ctrl or Stress mice (n = 10 mice per group). d Representative Hematoxylin-eosin (HE) photomicrographs, NANOG and Ki67 immunohistochemical (IHC) staining in Py8119-pLVX-MCS-Luc2 subcutaneous tumors (Scale bar, 50 μm). e Quantitative results of HE and IHC staining from indicated markers in indicated groups (n = 6 representative images). f Schematic of MMTV-PyMT mice in Ctrl and Stress groups treated with an antibiotic cocktail (Abx) or H2O (n = 6 mice per group). The Abx and Abx+Stress groups received Abx treatment throughout the experiment for 32 days. g Representative images of the MMTV-PyMT mice treated with Abx or H2O in Ctrl and Stress groups. h Tumor volumes curves in the Ctrl and Stress groups treated with Abx or H2O (n = 6 mice per group). i Relative protein levels of NANOG and SOX2 in MMTV-PyMT tumors. j Schematic of the NOD/SCID mice under Ctrl or Stress conditions. Mice were orthotopically injected with 1×10⁶ MDA-MB-231 cells and treated with Abx or H2O (n = 8 mice per group). The Abx and Abx+Stress groups received Abx treatment throughout the experiment for 32 days. NOD/SCID mice were orthotopically inoculated with MDA-MB-231 cells and treated with Abx or H2O in the Ctrl and Stress groups. Representative images of MDA-MB-231 xenograft tumors (k) and tumor volumes curves (l) are shown (n = 8 mice per group). m ALDH+ cells in MDA-MB-231 primary tumors (n = 3 biological replicates). n Representative images of spheroid formed by a single MDA-MB-231 tumor primary cell (left). Data represent the number of spheres per 400 cells (d > 50 μm) (middle) and the diameter of spheres (right) (Scale bars, 100 μm). o Extreme limiting dilution assays (ELDA) were performed in MDA-MB-231 tumor primary cells. Representative sphere images are shown (Scale bars, 50 μm). Stemness frequency of cells with the upper and lower 95% confidence intervals that shows the frequency of one stem cell in the tumors. Spheres were counted from 24 replicate wells. All data represent the mean ± s.d. (c, h, l) by two-tailed, unpaired Student’s t-test at the ethical endpoint, e, m, n by one-way analysis of variance (ANOVA), o by the likelihood ratio test. P values are as indicated
Fig. 2
Fig. 2
Deficiency of A. muciniphila determines psychological stress-triggered tumor development and anxiety-like behavior. a Alpha diversity of the gut microbiota between the Ctrl and Stress mice inoculated with Py8119 cells, as indicated by Chao1 indices (n = 10 mice per group). b PCA of fecal microbiota from the Ctrl and Stress mice inoculated with Py8119 cells (n = 10 mice per group). c Taxonomic cladogram generated from LEfSe of metagenomic sequencing data. Green indicates species level in the Ctrl mice whereas red show the species level in the Stress mice inoculated with Py8119 cells. The criteria of feature selection are log10 LDA score > 3.1. d Heatmap of the selected most differentially abundant features at the species level in feces of Ctrl and stressed mice inoculated with Py8119 cells (n = 10 mice per group). e Venn diagram showing the overlap of from LEfSe (log10 LDA score > 3.1) and differentially abundant species from heatmap (p < 0.05) (up). Five bacterial species abundance in Ctrl and Stress groups (down) (n = 10 mice per group). f Schematic of the Ctrl or stressed C57BL/6 J mice inoculated with Py8119 cells with A. muciniphila (AKK) administration. The AKK and Stress+AKK groups were treated with 200 μl (3 × 10⁸ CFU) AKK for 21 days (n = 8 mice per group). g Representative bioluminescence images of Py8119-pLVX-MCS-Luc2 orthotopic tumors in Ctrl and Stress groups treated with AKK or saline. h Tumor volumes curves in Ctrl and Stress mice treated with AKK or saline (n = 8 mice per group). i Representative HE photomicrographs, NANOG and Ki67 staining in tumors from the Ctrl and Stress group treated with AKK or saline (Scale bar, 50 μm). j Quantitative results of IHC staining from indicated markers in indicated groups (n = 6 representative images). k Schematic of the Ctrl or stressed C57BL/6J mice inoculated with Py8119 cells. Stressed mice were treated with 200 μl AKK-Supernatant (Sup) (3 × 10⁸ CFU) or Dead-AKK (heat-killed) for 21 days (n = 8 mice per group). l Representative bioluminescence images of Py8119-pLVX-MCS-Luc2 orthotopic tumors between Ctrl, Stress, stressed mice treated with AKK-Sup or Dead-AKK. m Tumor volumes curves in Ctrl and Stress mice and stressed mice treated with AKK-Sup or Dead-AKK (n = 8 mice per group). All data represent the mean ± s.d. (a, d, e, h, m) by two-tailed, unpaired Student’s t-test, b by Weighted UniFrac ANOSIM analysis, j by one-way ANOVA. For multiple comparisons, p-values were adjusted using the FDR correction. P values are as indicated
Fig. 3
Fig. 3
Administration of A. muciniphila-associated butyric acid reverses stress-mediated cancer stemness and anxiety-like behavior. a The enriched KEGG metabolic pathways of upregulated fecal microbiota genes in C57BL/6J mice inoculated with Py8119 tumors following stress treatment. b The enriched GO metabolic pathways of upregulated fecal microbiota genes in C57BL/6J mice inoculated with Py8119 tumors following stress treatment. c Levels of fecal short chain fatty acids (SCFAs) such as acetic acid (AA), propionic acid (PA), butyric acid (BA), isobutyric acid (IBA), valeric acid (VA), isovaleric acid (IVA), 4-methylvaleric acid (4-MVA), hexanoic acid (HA) in mice inoculated with Py8119 tumors undergoing stress paradigm (n = 10 mice per group). d Levels of multiple SCFAs in Py8119 tumors following stress treatment (n = 10 mice per group). e Levels of fecal butyric acid in mice inoculated with Py8119 tumors undergoing stress paradigm and AKK treatment (n = 8 mice per group). f Schematic of the MMTV-PyMT mice in Ctrl and Stress groups treated with 200 mg/kg sodium butyrate (NaBu) or saline (n = 6 mice per group). g Representative tumor images from MMTV-PyMT mice treated with NaBu or saline in the Ctrl and Stress groups (n = 6 mice per group). h Tumor growth curves of MMTV-PyMT mice (n = 6 mice per group). i Relative protein levels of NANOG and SOX2 in MMTV-PyMT tumors. j Schematic of the Ctrl or stressed C57BL/6J mice inoculated with Py8119 cells. The NaBu and NaBu+Stress groups treated with 200 mg/kg NaBu or saline (n = 8 mice per group) for 21 days. k Representative bioluminescence images of Py8119-pLVX-MCS-Luc2 orthotopic tumors in the Ctrl and Stress groups treated with NaBu or saline. l Tumor volumes from Ctrl and Stress mice treated with NaBu or saline (n = 8 mice per group). m Representative HE photomicrographs and NANOG and Ki67 staining from tumors of the Ctrl and Stress group treated with NaBu or saline (Scale bar, 50 μm). n Quantitative results IHC staining from indicated markers in indicated groups (n = 6 representative images). o Schematic of C57BL/6J mice inoculated with Py8119 cells in the Ctrl and Stress groups treated with high fiber diet (HFD) or normal diet (ND) for 21 days (n = 8 mice per group). p Representative bioluminescence images of Py8119-pLVX-MCS-Luc2 orthotopic tumors from Ctrl and Stress mice given the HFD or ND. q Tumor volumes from Ctrl and Stress mice treated with or without HFD (n = 8 mice per group). All data represent the mean ± s.d. (a, b) by Mann Whitney U test, (c, d, h, l, q) by two-tailed, unpaired Student’s t-test. e, n by one-way ANOVA. For multiple comparisons, p-values were adjusted using the FDR correction. P values are as indicated
Fig. 4
Fig. 4
Blockage of LRP5-mediated Wnt/β-catenin signaling via butyrate inhibits cancer stemness. a Heatmap showing differentially expressed genes (DEGs) between untreated SK-BR-3 cells and SK-BR-3 cells treated with 4 mM NaBu for 48 hours. The number of significant variant genes (FC > 2) are shown (FC, fold change) (n = 3 biological replicates). b Venn diagram showing the overlap of downregulated genes from NaBu-treated SK-BR-3 cells (FC > 2, P < 0.05, 1165 genes) and upregulated genes in MDA-MB-231 spheres (FC > 2, P < 0.05, 2571 genes) and the subsequent GO analysis. c Venn diagram showing the overlap of downregulated genes from NaBu-treated SK-BR-3 cells, upregulated genes in MDA-MB-231 spheres and stemness genes. d Expression of mRNA for the indicated genes in SK-BR-3 Ctrl cells and spheres (n = 3 biological replicates). e Relative LRP5 mRNA expression in SK-BR-3 cells treated with NaBu for 48 h in dose-dependent manner (n = 3 biological replicates). f Relative mRNA expression of LRP5, SOX2, and NANOG in Ctrl and LRP5-forced expression SK-BR-3 cells treated with NaBu (4 mM) for 48 h or vehicle (n = 3 biological replicates). g ALDH+ cells in Ctrl and LRP5-forced expression SK-BR-3 cells treated with NaBu (4 mM) for 48 h or vehicle (n = 3 biological replicates). h ELDA was performed in Ctrl and LRP5-forced expression SK-BR-3 cells treated with NaBu (4 mM) for 48 h or vehicle, and representative sphere images are shown (Scale bars, 50 μm). Stemness frequency with the upper and lower 95% confidence intervals that indicate the frequency of one stem cell in tumors. Spheres were counted from 24 replicate wells. i Representative images of spheroids formed by single cells in the 4 groups (Scale bars, 100 μm) (up), number of spheres per 1000 cells (d > 50 μm) (middle), and distribution pattern of sphere diameter (down). j Relative LRP5, p-GSK3β, GSK3β and β-catenin protein levels in Ctrl and LRP5-forced expression SK-BR-3 cells treated with NaBu (4 mM) for 48 h or vehicle. k Representative immunofluorescence images of β-catenin protein (green) in the 4 groups, with nuclear staining with DAPI (blue) (Scale bars, 25 μm). l Western blot detects the expression of nuclear and cytoplasmic protein extracts from Ctrl and LRP5 forced expression SK-BR-3 cells treated with NaBu (4 mM) for 48 h or vehicle. Actin was used as a cytoplasmic internal loading control and Lamin B1 as the nuclear internal control. Results are presented as mean ± s.d. (a, d, e) by a two-tailed, unpaired Student’s t-test, (f, g, i) by one-way ANOVA, h by the likelihood ratio test. For multiple comparisons, p-values were adjusted using the FDR correction. P values are as indicated
Fig. 5
Fig. 5
Butyrate accelerates LRP5 mRNA decay by transactivating ARE binding protein ZFP36. a Stability of LRP5 mRNA in SK-BR-3 cells treated with NaBu (4 mM) or vehicle (n = 3 biological replicates). b Stability of LRP5 mRNA in MDA-MB-231 cells treated with 4 mM NaBu or vehicle (n = 3 biological replicates). c Relative luciferase activity of psiCHECK2-LRP5-3’UTR-WT, Mut1, Mut2, and Mut1 + 2 in HEK293T cells treated with NaBu (4 mM) or vehicle (n = 3 biological replicates). d Volcano plots displaying DEGs comparing SK-BR-3 cells treated with NaBu (4 mM) or vehicle. The number of significant variant genes (FC > 2, P < 0.05) are shown. e Relative ZFP36 and pre-ZFP36 mRNA levels of SK-BR-3 and MDA-MB-231 cells treated with NaBu for 48 h in dose-dependent manner (n = 3 biological replicates). f Relative ZFP36, LRP5, and β-catenin protein levels in SK-BR-3 cells after transfection with the siRNA targeting these three GPRs and treated with NaBu (4 mM). g Relative ZFP36, LRP5, β-catenin, Histone H3-K9, and Histone H3 protein levels in SK-BR-3 cells treated with NaBu (4 mM) and TSA (1 μM; MCE, HY-15144). h Genome browser images showing ChIP-seq signals for the ZFP36 promoter using data from the Cistrome Data Browse (GSM810671). i Relative fold change of the ZFP36 promoter binding motif in SK-BR-3 and MDA-MB-231 cells treated with NaBu (4 mM) for 48 h or vehicle as analyzed by ChIP-qPCR (n = 3 biological replicates). j Enrichment of endogenous LRP5 3’UTR in SK-BR-3 and MDA-MB-231 cells treated with NaBu (4 mM) for 48 h or vehicle was analyzed by RNA immunoprecipitation (RIP) (n = 3 biological replicates). Relative LRP5 and ZFP36 mRNA expression (k) and stability of LRP5 mRNA (l) in SK-BR-3 cells treated with knockdown of ZFP36 and NaBu (4 mM), as assessed by RT-qPCR (n = 3 biological replicates). m Relative luciferase activity of psiCHECK2-LRP5-3’UTR-WT, Mut1, Mut2, and Mut1 + 2 in HEK293T cells treated with ZFP36 knocked down and NaBu (4 mM) (n = 3 biological replicates). n Relative ZFP36, LRP5, p-GSK3β, GSK3β, and β-catenin protein levels in SK-BR-3 cells treated with ZFP36 knocked down and NaBu (4 mM). o Representative immunofluorescence images of β-catenin protein (green) in SK-BR-3 cells treated with ZFP36 knocked down and NaBu (4 mM). The nucleus was stained with DAPI (blue) (Scale bars, 25 μm). p ALDH+ SK-BR-3 cells treated with ZFP36 knocked down and NaBu (4 mM) (n = 3 biological replicates). Results are presented as mean ± s.d. (ae, i, j) by a two-tailed, unpaired Student’s t-test, (k, l, m, p) by one-way ANOVA. For multiple comparisons, p-values were adjusted using the FDR correction. P values are as indicated
Fig. 6
Fig. 6
Clinical relevance of A. muciniphila, butyric acid and LRP5/β-catenin expression in breast cancer patients with negative mood. a Alpha diversity of gut microbiota between the HADS low (n = 24) and high (n = 33) groups of cohort 1 breast cancer patients, as indicated by Chao1 indices. b PCoA of fecal microbiota from cohort 1 breast cancer patients in the HADS low (n = 24) and high (n = 33) groups. c Volcano plots of the species level in the patients’ feces between the HADS low (n = 24) and high (n = 33) groups. The number of significant variant genes (P < 0.05) are shown. Levels of fecal butyric acid (d) and serum butyric acid (e) in cohort 1 breast cancer patients in the HADS low (n = 24) and HADS high (n = 33) groups. f Representative ZFP36, LRP5, β-catenin, and NANOG IHC staining images of tumors in patients in the low and high serum butyric acid groups (Scale bar, 50 μm). Pearson correlation between butyric acid concentrations of feces and ZFP36 (g), LRP5 (h), β-catenin (i) and NANOG (j) scores in breast cancer patients (n = 57). Statistical significance was determined by Pearson’s rank test. Relative ZFP36 (k) and LRP5 (l) mRNA expression between butyric acid in serum low (n = 19) and high (n = 20) groups in cohort 1 breast cancer patients. m Immunoblot analysis of proteins in breast tumor tissues (T) and adjacent normal breast tissues (N) (n = 5). Kaplan-Meier estimates of overall survival (OS) based on the expression of ZFP36 (n), LRP5 (o) and CTNNB1 (p). Patients were stratified into high-expression and low-expression groups using the median gene expression value as the cutoff in breast cancer patients. Results are presented as mean ± s.d. (a, c, d, e, k, l) by a two-tailed, unpaired Student’s t-test, (b) by weighted UniFrac ANOSIM analysis, gj by Pearson’s rank test. For multiple comparisons, p-values were adjusted using the FDR correction. P values are as indicated
Fig. 7
Fig. 7
Working model. Psychological stress alters gut microbial community and SCFA profiles during tumor development. Administration of Akkermansia muciniphila, butyrate or high-fiber diet markedly reverses stress-caused cancer stemness and anxiety-like behavior. Butyrate transactivates ZFP36 to accelerate LRP5 mRNA decay, thereby blocking Wnt/β-catenin signaling pathway to attenuate cancer stem-like traits. Part of the elements in this figure generated from BioRender (BioRender.com)

References

    1. Cao, L. et al. Environmental and genetic activation of a brain-adipocyte BDNF/leptin axis causes cancer remission and inhibition. Cell142, 52–64 (2010). - PMC - PubMed
    1. Eckerling, A. et al. Stress and cancer: mechanisms, significance and future directions. Nat. Rev. Cancer21, 767–785 (2021). - PubMed
    1. Cui, B. et al. Stress-induced epinephrine enhances lactate dehydrogenase A and promotes breast cancer stem-like cells. J. Clin. Invest.129, 1030–1046 (2019). - PMC - PubMed
    1. Batlle, E. & Clevers, H. Cancer stem cells revisited. Nat. Med.23, 1124–1134 (2017). - PubMed
    1. Malanchi, I. et al. Interactions between cancer stem cells and their niche govern metastatic colonization. Nature481, 85–89 (2011). - PubMed

MeSH terms

Supplementary concepts