Clinical Trial
. 2025 Mar 4;16(1):2146.
doi: 10.1038/s41467-025-57284-w.

Safety, immunogenicity and effect on viral rebound of HTI vaccines combined with a TLR7 agonist in early-treated HIV-1 infection: a randomized, placebo-controlled phase 2a trial

Collaborators, Affiliations
Clinical Trial

Safety, immunogenicity and effect on viral rebound of HTI vaccines combined with a TLR7 agonist in early-treated HIV-1 infection: a randomized, placebo-controlled phase 2a trial

Lucia Bailón et al. Nat Commun. .

Abstract

Building on results from the AELIX-002 trial with HIVACAT T-cell immunogen (HTI)-based vaccines, the AELIX-003 (NCT04364035) trial tested the safety of the combination of ChAdOx1.HTI (C) and MVA.HTI (M), with the TLR7 agonist vesatolimod (VES), in a double-blind, placebo-controlled, randomized clinical trial in 50 virally suppressed early-treated men with HIV-1 infection. Secondary objectives included immunogenicity and effects on viral rebound kinetics during a 24-week antiretroviral treatment interruption (ATI). The most common treatment-related adverse events were mild-to-moderate injection-site pain, influenza-like illness, headache, and fatigue. Strong, broad, and HTI-focused T-cell responses were induced by vaccination. All participants experienced viral rebound in ATI; 33.3% and 23.5% (P = 0.4494) of CCMM + VES and placebo recipients, respectively, remained off antiretroviral therapy for 24 weeks. Post hoc analysis confirmed a correlation between levels of HTI-specific T cells and prolonged time off antiretroviral therapy. The combination of HTI vaccines and VES was safe and elicited robust T-cell responses.


Conflict of interest statement

Competing interests: C.Brander and B.M. are co-inventors of the HTI immunogen (patent application PCT/EP2013/051596). C.Brander, B.M., and I.M. are co-inventors of US patent Application No. 62/935,519 and US Appl. No. 62/851,546, which have relevance to the vaccine regimen used in this study. B.M. reports consultancy, advisory, and/or speaker fees from AELIX Therapeutics, Gilead Sciences, Janssen, ViiV, and MSD. J.M. reports advisory board and speaker fees and grant support from MSD, AbbVie, Boehringer Ingelheim, Gilead Sciences, ViiV Healthcare, Janssen-Cilag, and Bristol Myers Squibb. A.C. reports advisory and speaker fees and grant support from Gilead Sciences, Janssen, MSD, and ViiV Healthcare. P.S. reports advisory and/or speaker fees and/or support for attending meetings from Gilead Sciences, Janssen-Cilag, Merck Sharp & Dohme, Pfizer, and ViiV Healthcare, and has received a research grant from ViiV Healthcare, all outside of the submitted work. J.B. reports speaker fees and grant support from Gilead Sciences and MSD. J.C. reports speaker fees and grant support from Gilead Sciences and MSD. J.A. reports advisory board and speaker fees and grant support from Gilead Sciences, Janssen, MSD, ViiV; data and safety monitoring board membership with Grifols and HIPRA; and is an employee of the European AIDS Clinical Society (guidelines coordinator). A.I. reports advisory and speaker fees and grant support from Gilead Sciences, Janssen, MSD, Theratechnologies, and ViiV. S.M. reports speaking fees and research grants from Gilead Sciences, Janssen-Cilag, MSD, and ViiV. P.D. reports lecture and advisory board fees from ViiV Healthcare, MSD, GSK, Roche, Theratechnologies, Janssen & Cilag, and Gilead. Y.C., Y.T., R.G., D.S., D.L. J.J.W., S.G., and E.V. are employees and stockholders of Gilead Sciences, Inc. M.F. is an employee of ClinData Insight Inc, whose services were funded by Gilead Sciences, Inc. I.M. was an employee of AELIX Therapeutics, is currently an employee of Orion Biotechnology and is a consultant for Synklino. M.G.G. was an employee of AELIX Therapeutics at the time the research was conducted. J.M.M. has received consulting honoraria and/or research grants from Angelini, Contrafect, Cubist, Genentech, Gilead Sciences, Jansen, Lysovant, Medtronic, MSD, Novartis, Pfizer, and ViiV Healthcare, outside the submitted work. J.N. has received honoraria and/or speaking fees and/or financial support for attending conferences from AbbVie, Gilead Sciences, Janssen-Cilag, Merck Sharp & Dome, and ViiV Healthcare outside of the submitted work. C.Brander is the cofounder, shareholder, and CSO of AELIX. J.R.A. reports advisory and speaker fees and grant support from ViiV, Janssen, Gilead Sciences, MSD, and AELIX Therapeutics. The remaining authors declare that the research was conducted in the absence of any conflict of interest.

Figures
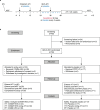
Fig. 1
Fig. 1. Trial design and participant disposition.
a Trial schedule and study visits. While on ART, ChAdOx1.HTI or placebo were administered at week 0 and week 12, followed by MVA.HTI or placebo at weeks 24 and 36. VES was administered at a dose of 6 mg orally, once every other week, for a total of ten doses from weeks 26 to 34 and 38 to 46 of the study; the last dose was administered 2 weeks before interrupting ART for a maximum of 24 weeks. b Participant disposition (CONSORT flow diagram).
Fig. 2
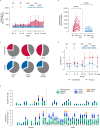
Fig. 2. Vaccine immunogenicity.
a Median and IQR magnitude of total HTI-specific T-cell response (sum of SFCs per 106 PBMCs for HTI pools P1–P10) over time in 33 CCMM + VES (shown in red) and 17 placebo (shown in blue) recipients from baseline to week 48. Statistics are derived from data from 24–30 (out of 33) CCMM + VES recipients and 13–16 (out of 17) placebo recipients at each timepoint, depending on sample availability and valid results after assay QC. Arrows indicate vaccination or VES/placebo administration dates. BL baseline, C ChAdOx1.HTI, M MVA.HTI, P placebo. b Individual magnitudes of HTI-specific response (sum of SFCs per 106 PBMCs for HTI pools P1–P10) in CCMM + VES (shown in red) and placebo (shown in blue) recipients, at study entry (BL), the timepoint between study entry and week 48 with the strongest observed total HTI-specific T-cell responses (peak) and at week 48 (ATI start). P value tested using a two-sided van Elteren test (P value <0.0001; unadjusted for multiple comparisons, with 5% error rate), with a stratification factor for the actual potential for superior viral control (yes/no). c Median contribution of HTI-specific T cells to total virus-specific responses, according to specificity. HTI-specific responses are shown in red for CCMM + VES and in blue for placebo recipients; non-HTI HIV-1-specific responses are shown in gray. d Median and IQR breadth of total HTI-specific T-cell response (number of reactive HTI pools P1–P10) over time in 33 CCMM + VES (red) and in 17 placebo (blue) recipients from baseline to week 48. Statistics are derived from data of 24–30 (out of 33) CCMM + VES recipients and 13–16 (out of 17) placebo recipients at each timepoint, depending on sample availability and valid results after assay QC. Arrows indicate vaccination or VES/placebo administration dates. e Distribution of HTI-specific responses within the different HIV-1 subproteins at study entry (BL) and accumulated up to the start of ATI for each placebo (P01–P17) and CCMM + VES (V01–V30) recipient.
Fig. 3
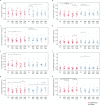
Fig. 3. VES PD responses in CCMM + VES and placebo recipients.
Serum levels were measured by single-molecule array assay for IFNα and multiplex cytokine assay for IP-10 (CXCL10), ITAC (CXCL11), and IL-1RA at baseline (BL), before and 24 h after the first VES/placebo dose (week 26), and before and 24 h after the 10th (last) VES/placebo dose (week 46). Colored-coded dots represent data collected from individual participants (red color was used to mark participants receiving CCMM + VES and blue for those receiving placebo). Median and IQR are shown with black dots and lines. Wilcoxon test was used to compare data at given timepoints between groups (unpaired) or data from two different timepoints within the same group longitudinally (paired; shown by brackets), reported using nominal P values. *P ≤ 0.0500, **P ≤ 0.0100, ***P ≤ 0.0010. CXCL C-X-C motif chemokine ligand.
Fig. 4
Fig. 4. Immune-cell activation in CCMM + VES and placebo recipients.
Whole blood specimens were collected to evaluate immune-cell activation (T cells, af) and natural killer (NK) cells (g, h) with flow cytometry at baseline (BL), before and 24 h after the first VES/placebo dose (week 26), and before and 24 h after the 10th planned (last) VES/placebo dose (week 46). Colored-coded dots represent data collected from individual participants (red color was used to mark participants receiving CCMM + VES, blue for those receiving placebo). Median and IQR are shown with black dots and lines. Wilcoxon test was used to compare data at given timepoints between groups (unpaired) or data from two different timepoints within the same group longitudinally (paired; shown by brackets), reported using nominal P values. *P ≤ 0.0500, **P ≤ 0.0100, ***P ≤ 0.0010.
Fig. 5
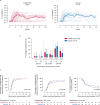
Fig. 5. HIV-1 RNA pVL during the ATI period.
a Individual and mean (thick line) values of HIV-1 plasma viral load (pVL) during the 24 weeks of ATI are represented in CCMM + VES (red) and placebo (blue) recipients. Lines are interrupted at the time of ART resumption. b Proportion of participants with HIV-1 pVL <50, <2000 copies/ml and remaining off ART at 12 and 24 weeks of ATI. Data shown for CCMM + VES (red) and placebo (blue) recipients. Error bars represent 95% confidence intervals estimated using the exact (Clopper–Pearson) method. Statistical comparison between treatment groups was performed using a two-sided Cochran–Mantel–Haenszel test, stratified by the potential for superior viral control (P values ≤0.05). c Time to HIV-1 pVL ≥50, ≥10,000, and percentage of participants remaining off ART during the ATI in CCMM + VES (red) and placebo (blue) recipients. Time to pVL ≥50 copies/ml was adjudicated as the first viral load assessment among the first occurrence of two consecutive visits with pVL ≥50 copies/ml during ATI. Median time to pVL ≥50 and 10,000 copies/ml was estimated in each treatment group using the Brookmeyer and Crowley method and compared between treatment groups using the stratified log-rank test adjusting for stratification factor potential for superior viral control.
Fig. 6
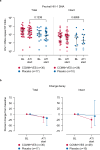
Fig. 6. HIV reservoir.
a Comparison between levels of total and intact proviral HIV-1 DNA at study entry (baseline; BL) and at week 48 (ATI start) in CCMM + VES (red) and placebo (blue) recipients. Participants with undetectable reservoirs are shown in open circles. Median and IQR values are shown. P values correspond to the van Elteren test stratifying on the factor for the potential for superior viral control. b Median and 95% CI percent change at ATI from baseline is shown for all the participants with a baseline and a post-baseline value at both visits. P values correspond to the van Elteren test stratifying on the factor for the potential for superior viral control.
Fig. 7
Fig. 7. Clinical, virological, and immunological correlates of ATI outcomes.
a are shown in a correlogram for CCMM + VES (left), placebo recipients (middle), and for all (right) participants who entered into the ATI phase (n = 47). Spearman’s ρ is used for correlations. All tests are two-sided, unadjusted for multiple comparisons, with a 5% error rate. Significant correlations are shown by * when P < 0.0500. b Individual correlation is shown for HTI magnitude at ATI start and time to either pVL >50, >10,000 copies/ml, or to ART resumption during the ATI in CCMM + VES (red) and placebo (blue) recipients. Spearman’s ρ and P values are shown for each treatment group.
Fig. 8
Fig. 8. Univariate correlate analysis for time off ART.
Data were shown for time to ART resumption >12 weeks in univariate logistic regression models in all AELIX-003 participants who entered the ATI phase (n = 47). Data were presented as odds ratios (orange-filled circles), and error bars represent 95% confidence intervals. In parentheses, for each variable, the unit of increment is shown for interpretation of the odds ratio. Univariate analyses were not adjusted for multiple comparisons. Abs CD4, absolute CD4 T cells/µl.

References

    1. Minior, T. et al. The critical role of supply chains in preventing human immunodeficiency virus drug resistance in low- and middle-income settings. J. Infect. Dis.216, S812–S815 (2017). - PMC - PubMed
    1. Deeks, S. G. et al. Research priorities for an HIV cure: International AIDS Society Global Scientific Strategy 2021. Nat. Med.27, 2085–2098 (2021). - PubMed
    1. Bailón, L. et al. Safety, immunogenicity and effect on viral rebound of HTI vaccines in early treated HIV-1 infection: a randomized, placebo-controlled phase 1 trial. Nat. Med.28, 2611–2621 (2022). - PubMed
    1. Mothe, B. et al. Therapeutic vaccination refocuses T-cell responses towards conserved regions of HIV-1 in early treated individuals (BCN 01 study). EClinicalMedicine11, 65–80 (2019). - PMC - PubMed
    1. Fidler, S. et al. Antiretroviral therapy alone versus antiretroviral therapy with a kick and kill approach, on measures of the HIV reservoir in participants with recent HIV infection (the RIVER trial): a phase 2, randomised trial. Lancet395, 888–898 (2020). - PubMed

Publication types