. 2025 Mar 4;16(1):2159.
doi: 10.1038/s41467-025-57476-4.

Inhibition of the STAT3/Fanconi anemia axis is synthetic lethal with PARP inhibition in breast cancer

Affiliations

Inhibition of the STAT3/Fanconi anemia axis is synthetic lethal with PARP inhibition in breast cancer

Celia D Rouault et al. Nat Commun. .

Abstract

The targeting of cancer stem cells (CSCs) has proven to be an effective approach for limiting tumor progression, thus necessitating the identification of new drugs with anti-CSC activity. Through a high-throughput drug repositioning screen, we identify the antibiotic Nifuroxazide (NIF) as a potent anti-CSC compound. Utilizing a click chemistry strategy, we demonstrate that NIF is a prodrug that is specifically bioactivated in breast CSCs. Mechanistically, NIF-induced CSC death is a result of a synergistic action that combines the generation of DNA interstrand crosslinks with the inhibition of the Fanconi anemia (FA) pathway activity. NIF treatment mimics FA-deficiency through the inhibition of STAT3, which we identify as a non-canonical transcription factor of FA-related genes. NIF induces a chemical HRDness (Homologous Recombination Deficiency) in CSCs that (re)sensitizes breast cancers with innate or acquired resistance to PARP inhibitor (PARPi) in patient-derived xenograft models. Our results suggest that NIF may be useful in combination with PARPi for the treatment of breast tumors, regardless of their HRD status.


Conflict of interest statement

Competing interests: The authors declare no competing interest

Figures
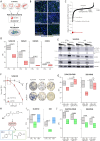
Fig. 1
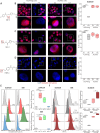
Fig. 1. Drug repurposing screen identifies Nifuroxazide (NIF) as a pro-drug specifically bioactivated in cancer stem cells.
A Schematic representation of high content screening strategy. Created in BioRender.com. https://BioRender.com/b62d917. B Representative images of the high-content screening capture from 3 technical replicates. ALDEFLUOR cellular staining (ALDHbr) is represented in green. Nuclei are counterstained in blue (Hoechst). Scale bar: 50 μm. C Z-score analysis of data from the screen. Scatter points represent compounds, the y-axis represents the mean of Z-Score of each cancer cell line. Compounds inducing a reduction of the ALDHbr cell proportion have a negative Z-score. D Tumorsphere forming efficiency (SFE) of cell lines under treatment with Nifuroxazide (NIF) compared to untreated condition (CTRL). n = 6 independent experiments. E Western blot of STAT3 and its downstream protein, cyclin D1 in SUM159 ALDHneg- and ALDHbr-sorted population for NIF-treated and untreated conditions (CTRL). The mean intensities are indicated below each band for each condition from 3 independent experiments. F SUM159 cells exposed to various concentrations of NIF were subjected to clonogenic survival assays and representative images. Scale bar: 2.5 cm. n = 3 independent experiments. G SFE of sgEmpty and sgALDH1A1 SUM159-KRAB, S86-KRAB in NIF-treated cells, estimated in a limiting dilution assay. n = 3 independent experiments. H NIF bio-activation with its derived metabolites M2 and HBH. I SFE of SUM159 and S68 under treatment with M2, HBH compared to untreated condition (CTRL). n = 3 independent experiments. J Tumorsphere forming efficiency (SFE) of sgEmpty and sgALDH1A1 SUM159-KRAB, S86-KRAB under M2 treatment and compared to untreated condition (CTRL). n = 3 independent experiments. In (D, G, I, J) box represents mean ± margin of error (95% Confidence Interval). Statistical significance was calculated using one-sided chi-squared test or t-test. In (F), data are shown as mean ± SEM (Standard Error of Mean), according to two-way ANOVA followed by Sidak multiple range test. ns (not significant), *p < 0.05, **p < 0.01, ***p < 0.001. Source data are provided as a Source Data file.
Fig. 2
Fig. 2. NIF and its bioactivated metabolite (M2) binds to DNA.
A Chemical structure of click compounds. BD Detection of NIF-Click (NIF-C), M2-Click (M2-C), and HBH-Click (HBH-C) (red staining) in ALDHneg and ALDHbr SUM159 cells after 6 and 72 h of treatment. Nuclei are counterstained with DAPI (blue staining). For each panel, bottom line represents an enlargement of the area delimited by dashed line. Scale bar: 5 μm. Box plots represent the proportion of cells with a positive click-labeling after different times of treatment. n = 3 independent experiments. E Detection of indicated click compounds by quantitative image-based cytometry (QIBC) after 6 h of treatment in SUM159 and S68 cells. Data are represented in boxplots for each click compound, n = 6 independent experiments. F Detection of NIF-C by QIBC after 24 or 72 h of treatment in ALDHneg or ALDHbr SUM159 and S68 cells. Data are represented in boxplots for each condition n = 3 independent experiments. In (BD), boxplots represent median and quartile and whiskers minimum to maximum. In (EF), boxplots represent the median of fluorescence and quartiles and whiskers minimum to maximum. ns (not significant), *P < 0.05, **P < 0.01, and ***P < 0.001 according to one-way ANOVA followed by Dunn’s multiple comparison test (BD) or two-way ANOVA followed by Sidak multiple range test (EF). Source data are provided as a Source Data file.
Fig. 3
Fig. 3. NIF induces DNA inter-strand crosslinks lesions that accumulate in breast cancer stem cells.
A Representative images of γH2AX foci (green staining) in ALDHneg and ALDHbr SUM159 cells. Nuclei are counterstained with DAPI (blue staining). Scale bar: 15 μm. Box plots represent the proportion of γH2AX -positive cells for each cell subpopulation under the indicated treatment and compared to the untreated condition (CTRL) for each drug. n = 3 independent experiments. Monitoring of cell cycle profile by QIBC in ALDHneg and ALDHbr SUM159 cells exposed to NIF and compared to untreated condition (CTRL) (B) Quantification of cell cycle phase distribution in each condition (C) Proportion of polyploid cells in each condition (D). n = 3 independent experiments. E Proportion of apoptotic cells determined by annexine V labeling in ALDHneg and ALDHbr SUM159 cells exposed to NIF and compared to untreated condition (CTRL). n = 3 independent experiments. F Role of FANCD2 and ERCC1 in DNA lesions (ICLs and/or mono-adduct) repair. Created in BioRender.com. https://BioRender.com/b62d917. G HeLa WT, FANCD2KO, or ERCC1KO cells exposed to various concentrations of M2 were subjected to clonogenic survival assays. n = 3 independent experiments. HJ Schematic representation of reverse comet assay principle (H), created in BioRender.com. https://BioRender.com/b62d917. Representative images of reverse comet assays conducted in ALDHneg and ALDHbr SUM159 cells subjected to the indicated treatments. Scale bar: 100 µm (I). Reverse comet assay quantification, each dot corresponding to tail moment of one comet with the indicated drugs. n = 200 comets analyzed. In (A), boxplots represent the median of fluorescence and quartiles and whiskers minimum to maximum. In (BE, HJ), data are shown as mean ± SD (Standard Deviation). ns (not significant), *P < 0.05, **P < 0.01 and ***P < 0.001 according to one-sided Fisher test (A, CE), two-way ANOVA followed by Sidak multiple range test (G), one-way ANOVA non-parametric test (J). Source data are provided as a Source Data file.
Fig. 4
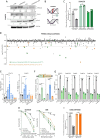
Fig. 4. NIF Inhibit the STAT3/Fanconi anemia axis.
A Detection of FANCD2, FANCI, and γH2AX by Western blot in SUM159 cell protein extracts after treatment with melphalan, M2, or the combination. Numbers under the blots indicate the fold induction relative to untreated samples. L/S indicates the ratio of monoubiquitinated (L, upper band) to non-monoubiquitinated (S, lower band) FANCD2 or FANCI protein. B Schematic representation of ICLick assay. DNA lesions generated by click-melphalan are detected in red, and its repair can be monitored via the disappearance of the click-labeling. Created in BioRender.com. https://BioRender.com/b62d917. C Quantification of click-labeling (fluorescence intensity) in shCTRL, shCTRL+M2, and shFANCD2 SUM159 cells treated with click-melphalan after 24 h and 72 h of treatment. D Expression of FANCI following the individual treatment of 875 compounds and normalized with DMSO-treated condition used as control. This dot plot has been generated with the DeepCoverMOA web interface. Two families of compounds that significantly decrease FANCI expression are highlighted with MDM2/P53 inhibitors in green or JAK/STAT pathway inhibitors in orange. E CUT&RUN-qPCR of STAT3 in SUM159-KRAB cell under indicated treatment. Data are represented by the fold-change of DNA level normalized on sgSTAT3 condition. P1 and P2 correspond to the two sets of primer designed on STAT3 and FANCI promoter sequence. n = 6 independent experiments. F Schematic representation of FANCI reporter (top panel). Relative luciferase activity measured in SUM159 cells expressing the FANCI promoter after indicated treatment. G mRNA levels of FA genes, measured by qRT-PCR, in SUM159 treated with M2, IL-6, or in combination, normalized with untreated conditions (CTRL). H SUM159 and S68 shCTRL, shFANCD2#1, and shSTAT3 cells exposed to various concentrations of melphalan were subjected to clonogenic survival assays. I Quantification of fluorescence intensity in sgCTRL and sgSTAT3 SUM159-KRAB treated with click-melphalan and measured after 24 h and 72 h of treatment. In (C, EI), data are shown as mean ± SD. ns (not significant), *P < 0.05, **P < 0.01, and ***P < 0.001 according to one-sided Fisher test (C, E, F, G, I), two-way ANOVA followed by Sidak multiple range test (H). n = 3 independent experiments. Source data are provided as a Source Data file.
Fig. 5
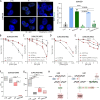
Fig. 5. NIF is an inducer of chemical HRDness.
A Representative images of RAD51 foci (green staining) in SUM159 cells irradiated (IR) or treated with melphalan alone or in combination with M2 and compared to untreated condition (CTRL). Nuclei are counterstained with DAPI (blue staining). Scale bar: 5μm. Box plots represent the proportion of RAD51-positive nuclei for each treatment condition. BE SUM159 (HRP) and SUM149 (HRD) ALDHbr and ALDHneg cells exposed to various concentrations of PARPi were subjected to clonogenic survival assays (B, D). SUM159 and SUM149 ALDHbr and ALDHneg cells treated with a sublethal dose of PARPi (or untreated cells) were exposed to various concentrations of NIF and subjected to clonogenic survival assays (C, E). FG SFE of SUM159 and SUM149 NIF-, PARPi- or combination-treated cells. H Working model illustrating chemical HRDness of NIF and its synthetic lethal interaction with PARPi in HRP cells compared to synthetic lethality induced in HRD cells. Created in BioRender.com. https://BioRender.com/b62d917. In (AE), data are shown as mean ± SD, and in (FG) box represents mean ± margin of error (95% Confidence Interval) of 3 independent experiments. ns (not significant), *P < 0.05, **P < 0.01 and ***P < 0.001 according to t-test (A), two-way ANOVA followed by Sidak multiple range test (BE), One-sided Chi-squared test (F, G). Source data are provided as a Source Data file.
Fig. 6
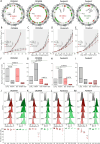
Fig. 6. NIF/PARPi combination induced synthetic lethality in PARPi-resistant PDXs.
A Circos plot showing genomic variations in PDX models. Color-coded chromosomes are arranged around the outside of the circle; CNA is shown in the inner ring (green, deletion; red, gain). Mutations and Genomic Instability index (GI index) are located inside the circus plot. BE Effect of NIF and PAPRi treatment alone or in combination on the tumor growth of each PDX, compared with the vehicle-treated condition (CTRL). The gray area corresponds to the treatment period. Growth curves represent the mean ± SEM of tumor volume for n = 8 tumors per treatment group. FI. Box plots represent bCSC frequency calculated using an extreme limiting dilution analysis (ELDA). The results are expressed as the estimated number of bCSCs for 100 tumor cells. n = 15 injections per PDX. JM Detection of click-melphalan (Melphalan-C) or click-M2 (M2-C) residual DNA lesions after different time points of treatment in patient-derived organoids (PDXOs) (upper panel). Dot plots represent the percentage of fluorescent positive cells for Melphalan-C (in red) and M2-C (green) at different time points and for each PDXO. n = 4 independent experiments. In (FI) box represents mean ± margin of error (95% Confidence Interval), and in (JM), data are shown as mean ± SD. ns (not significant), *P < 0.05, **P < 0.01, and ***P < 0.001 according to two-way ANOVA followed by Bonferroni correction (BE, G), one-sided Chi-squared test (FI), and two-way ANOVA followed by sidak multiple range test of 3 independent experiments (JM). Source data are provided as a Source Data file.

References

    1. Al-Hajj, M., Wicha, M. S., Benito-Hernandez, A., Morrison, S. J. & Clarke, M. F. Prospective identification of tumorigenic breast cancer cells. Proc. Natl. Acad. Sci. USA100, 3983–3988 (2003). - PMC - PubMed
    1. O’Brien, C. A., Pollett, A., Gallinger, S. & Dick, J. E. A human colon cancer cell capable of initiating tumour growth in immunodeficient mice. Nature445, 106–110 (2007). - PubMed
    1. Singh, S. K. et al. Identification of human brain tumour initiating cells. Nature432, 396–401 (2004). - PubMed
    1. Ginestier, C. et al. ALDH1 Is a marker of normal and malignant human mammary stem cells and a predictor of poor clinical outcome. Cell Stem Cell1, 555–567 (2007). - PMC - PubMed
    1. Eppert, K. et al. Stem cell gene expression programs influence clinical outcome in human leukemia. Nat. Med.17, 1086–1093 (2011). - PubMed

MeSH terms

Substances