. 2025 Mar 4;16(1):2191.
doi: 10.1038/s41467-025-57225-7.

A metabolic synthetic lethality of phosphoinositide 3-kinase-driven cancer

Affiliations

A metabolic synthetic lethality of phosphoinositide 3-kinase-driven cancer

Guillaume P Andrieu et al. Nat Commun. .

Abstract

The deregulated activation of the phosphoinositide 3-kinase (PI3K) pathway is a hallmark of aggressive tumors with metabolic plasticity, eliciting their adaptation to the microenvironment and resistance to chemotherapy. A significant gap lies between the biological features of PI3K-driven tumors and the specific targeting of their vulnerabilities. Here, we explore the metabolic liabilities of PI3K-altered T-cell acute lymphoblastic leukemia (T-ALL), an aggressive hematological cancer with dismal outcomes. We report a metabolic crosstalk linking glutaminolysis and glycolysis driven by PI3K signaling alterations. Pharmaceutical inhibition of mTOR reveals the singular plasticity of PI3K-altered cells toward the mobilization of glutamine as a salvage pathway to ensure their survival. Subsequently, the combination of glutamine degradation and mTOR inhibition demonstrates robust cytotoxicity in PI3K-driven solid and hematological tumors in pre-clinical and clinical settings. We propose a novel therapeutic strategy to circumvent metabolic adaptation and efficiently target PI3K-driven cancer.


Conflict of interest statement

Competing interests: The authors declare no competing interests.

Figures

Fig. 1
Fig. 1. PI3K signaling alterations define an aggressive subgroup of leukemia.
A Incidence of PI3K signaling alterations in the GRAALL03-05 and FRALLE2000 cohorts. The nature of the oncogenetic lesions is indicated. B Overall survival of the patients stratified by their status regarding PI3K signaling (wild-type (WT) or altered (ALT). Outcome comparisons were performed using a Cox regression analysis. C Engraftment rates of primografts following the injection of fresh primary T-ALL samples into NSG mice evaluated from 101 primograft attempts. Successful engraftment rates are indicated (wild-type: 55/80 (68.8%) vs altered: 19/21 (90.5%) patients). D Time-to-leukemia analysis evaluated in PDX models as the time from injection to a leukemic burden >90% (wild-type (WT), n = 57 individual PDX; PI3K-altered (ALT), n = 21 individual PDX). An unpaired Mann-Whitney test was run (***, p < 0.001). E Leukemia-free survival of the PDX using the same criterion. Outcome comparisons were performed using a Cox regression analysis.
Fig. 2
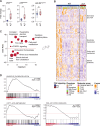
Fig. 2. Sustained PI3K signaling activation is coupled with glycolytic and mitochondrial metabolism transcriptomic signatures.
A Phosflow evaluation of PI3K signaling activity in leukemic blasts (wild-type: n = 16 PDX, PI3K-altered: n = 16 PDX). Box plots show minima, maxima, median, and 25% and 75% percentiles. Unpaired Welch-corrected two-tailed t-test (pAktS473) and two-tailed Mann-Whitney tests (pS6S235/236, p4E-BP1T37/46) were run (ns, p > 0.05; ***, p < 0.001). B Heatmap of expression by transcriptomics and clustering analysis of the 75 metabolic genes differentially expressed in PI3K-altered vs wild-type patients (WT: 122 patients, ALT: 33 patients). Differential expression was defined by an absolute log2 fold change >1 and an adjusted p value < 0.05 from DESeq2 analysis (Wald test-adjusted for multiple comparisons). The metabolic pathways enriched in the gene clusters are listed. C Pathway enrichment analysis in PI3K-altered vs wild-type T-ALL samples using the 75 significantly deregulated metabolic genes in PI3K-altered vs WT samples. An over-representative analysis adjusted for multiple comparisons was run with MetaboAnalyst. A positive odds ratio indicates an enrichment in in PI3K-altered samples. Bubble sizes indicate the number of deregulated genes mapped to each pathway. D Gene set enrichment analyses based on the expression of 2141 metabolic genes in 155 patients stratified by their PI3K signaling status (GSEA-based over-representative analysis adjusted for multiple comparisons).
Fig. 3
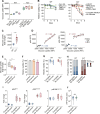
Fig. 3. Aberrant PI3K signaling polarizes leukemia metabolism towards glycolysis.
A Glucose uptake in T-ALL cell lines. Each dot represents a replicate. Box plots show minima, maxima, median, and 25% and 75% percentiles. B Cell viability at 72 h of wild-type and PI3K-altered T-ALL cell lines under complete culture conditions or without glucose (mean ± SEM are indicated per cell line from three replicates in three independent experiments). C Glucose uptake in wild-type (n = 9 individual PDX) and PI3K-altered (n = 12 individual PDX) T-ALL PDX. Box plots show minima, maxima, median, and 25% and 75% percentiles. An unpaired Welch-corrected two-tailed t-test was run (***, p < 0.001). D Pearson correlations between phosflow p-Akt or p-S6 and glucose uptake levels in wild-type (n = 14 individual PDX) PI3K-altered (n = 8 individual PDX) T-ALL PDX. The SEM is indicated by the gray area. E Glucose uptake in PI3K-altered PDX was measured at 72 h upon PI3K signaling inhibition (n = 8 individual PDX). Box plots show minima, maxima, median, and 25% and 75% percentiles. A one-way ANOVA test adjusted for multiple comparisons (Dunn–Šidák correction) was run (*, p < 0.05; ***, p < 0.001). F Cell viability at 72 h of PI3K-altered PDX was measured upon PI3K signaling (mean ± SEM, n = 8 individual PDX). A one-way ANOVA adjusted for multiple comparisons (Dunn’s test) was performed (ns, p > 0.05). G Cell viability at 72 h of wild-type and PI3K-altered T-ALL PDX under complete culture conditions or without glucose (n = 18 individual PDX evaluated in duplicates). H Cell proliferation of CellTrace-labelled wild-type and PI3K-altered T-ALL PDX was evaluated after 72 h in complete culture condition or without glucose (mean ± SEM, n = 4 individual PDX). Each generation was defined by a CellTrace peak. I Phosflow evaluation of PI3K signaling activity in wild-type (n = 14) and PI3K-altered (n = 8) blasts cultured for 72 h in complete medium or without glucose. Box plots show minima, maxima, median, and 25% and 75% percentiles. J ATP levels in PI3K-altered PDX were evaluated after 72 h in complete culture condition or without glucose (n = 8 individual PDX) by LC/MS. Relative abundances are indicated. Box plots show minima, maxima, median, and 25% and 75% percentiles. An unpaired homoscedastic two-tailed t-test was performed (ns, p > 0.05).
Fig. 4
Fig. 4. PI3K-altered leukemias rely on glutamine metabolism to cope with glucose limitation.
A Volcano plots indicating differential metabolite fold change in wild-type (n = 7 individual PDX) and PI3K-altered (n = 7 individual PDX) blasts cultured for 72 h without glucose vs complete medium. For each genotype, a two-tailed unpaired homoscedastic t-test was performed. Adjusted p values were used. B Bubble plots depicting metabolic pathway modulation upon glucose deprivation. The size of the bubbles is proportional to the number of differentially detected metabolites mapped to each pathway (x-axis: score, y-axis: -log10(pajd)). An over-representative analysis adjusted for multiple comparisons was run with MetaboAnalyst. C Relative metabolite concentrations in wild-type (n = 7 individual PDX) and PI3K-altered (n = 7 individual PDX) PDX blasts cultured for 72 h without glucose vs complete medium. Relative abundances are indicated. Box plots show minima, maxima, median, and 25% and 75% percentiles. Two-way ANOVA tests adjusted for multiple comparisons (Tukey correction) were run (ns, p > 0.05; *, p < 0.05; **, p < 0.01; ***, p < 0.001). D Metabolic tracing with 13C5-glutamine performed on PI3K wild-type (n = 3 individual PDX) and PI3K-altered (n = 3 individual PDX) T-ALL PDX blasts cultured for 24 h in complete or glucose-free media then incubated with 2 mM 13C5-glutamine for the indicated times. Left. Schematic representation of the labeling strategy. Right. Labeled fraction of 13C5-glutamine-derived metabolite. Each analyzed isotopologue is indicated. Each dot represents the average ± SEM of three biological replicates of the three samples per condition.
Fig. 5
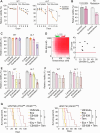
Fig. 5. Glucose limitation reveals a synthetic lethality to glutamine targeting in PI3K-driven leukemia.
A Relative cell viability of wild-type PI3K (n = 14 individual PDX) and PI3K-altered (n = 8 individual PDX) PDX blasts after 72 h of culture in complete or glucose-free medium with control (DMSO) or CB-839 1 µM treatment (mean + SEM are indicated). One-way ANOVA tests adjusted for multiple comparisons (Šidák correction) were run (*, p < 0.05; **, p < 0.01; ***, p < 0.001). B Relative cell viability of PI3K-altered (n = 8 individual PDX) PDX blasts after 72 h of culture in complete or glutamine-free medium with control (DMSO) or temsirolimus 200 nM treatment (mean + SEM are indicated). A one-way ANOVA test adjusted for multiple comparisons (Dunn–Šidák correction) was run (ns, p < 0.05; ***, p < 0.001). C Relative cell viability of wild-type PI3K (n = 14 individual PDX) and PI3K-altered (n = 8 individual PDX) PDX blasts after 72 h of culture treated with control (DMSO), CB-839 1 µM, temsirolimus 200 nM or combined treatment (mean + SEM are indicated, each dot is a biological replicate). A one-way ANOVA test adjusted for multiple comparisons (Dunnett correction) was run (***, p < 0.001). D Left: Heatmap depicting the Bliss synergy score of the combination CB-839 + temsirolimus computed from viability data of PI3K-altered PDX blasts (n = 7 individual PDX). Right: individual Bliss scores mapped to matched CB-839 IC50 values. A Bliss score >10 indicates synergy. E Relative cell viability of wild-type PI3K (n = 4 individual PDX) and PI3K-altered (n = 8 individual PDX) PDX blasts after 72 h of culture treated with control (DMSO), temsirolimus 200 nM, erwinase 1 U/ml or combined treatment (mean + SEM are indicated). A Kruskal-Wallis test adjusted for muliple comparisons (Dunn correction) was run (***, p < 0.001). F Relative cell viability of wild-type PI3K (n = 4 individual PDX) and PI3K-altered (n = 4 individual PDX) after 72 h of culture treated with control (DMSO), temsirolimus 200 nM, kidrolase 1 U/ml or combined treatment (mean + SEM are indicated). A Kruskal-Wallis test adjusted for multiple comparisons (Dunn correction) was run. G Survival curves of mice xenografted with two PI3K-altered PDX (5 mice/arm/PDX) and treated with vehicule, erwinase, CB-839, temsirolimus, or the indicated combinations. Outcome comparisons were performed using a Cox regression analysis (**, p < 0.01; ***, p < 0.001).
Fig. 6
Fig. 6. Clinical evaluation of the erwinase-temsirolimus combination in PI3K-driven leukemia.
A Swimmer plots presenting the clinical history, treatment course, response, and outcome of the patients. B Bone marrow response, chest CT, and FDG-ET/CT evaluation of two patients presented a significant reduction in the tumor burden following treatment with the erwinase-temsirolimus association. Each dot represents a patient. C Oncoplot presenting the main oncogenetic characteristics of the treated patients.
Fig. 7
Fig. 7. PI3K-driven cancers are sensitive to the erwinase-temsirolimus combination.
A Pearson correlation between the difference of cytotoxicity of L-asparaginase (either erwinase – left or kidrolase – right) and temsirolimus minus the effect of L-asparaginase alone (∆ cytotoxicity) and the ZIP synergy score of the combination. B Pearson correlation between the ∆ cytotoxicity and the ZIP synergy score of erwinase-temsirolimus stratified by cancer type. C ZIP synergy score of the combination of erwinase/temsirolimus (top) or kidrolase/temsirolimus (bottom) in the tested cancer models. D Cytotoxicity of erwinase (Erw), temsirolimus (Tem), kidrolase (Kid), or their combination on the broad array of either wild-type PI3K (blue) or PI3K-altered (red) solid cancer cell lines. Significative differences in cell viability relative to control are indicated by a black dot. A two-way ANOVA test adjusted for multiple comparisons (Dunn–Šidák correction) was computed.

References

    1. Vivanco, I. & Sawyers, C. L. The phosphatidylinositol 3-Kinase–AKT pathway in human cancer. Nat Rev Cancer. Nat. Publ. Group2, 489–501 (2002). - PubMed
    1. Fruman, D. A. & Rommel, C. PI3K and cancer: lessons, challenges and opportunities. Nat. Rev. Drug Discov. Nat. Publ. Group13, 140–156 (2014). - PMC - PubMed
    1. Hoxhaj, G. & Manning, B. D. The PI3K–AKT network at the interface of oncogenic signalling and cancer metabolism. Nat Rev Cancer. Nat. Publ. Group20, 74–88 (2020). - PMC - PubMed
    1. Vanhaesebroeck, B., Perry, M. W. D., Brown, J. R., André, F. & Okkenhaug, K. PI3K inhibitors are finally coming of age. Nat. Rev. Drug Discov.20, 741–769 (2021). - PMC - PubMed
    1. Asnafi, V. et al. Analysis of TCR, pT alpha, and RAG-1 in T-acute lymphoblastic leukemias improves understanding of early human T-lymphoid lineage commitment. Blood101, 2693–2703 (2003). - PubMed

MeSH terms

LinkOut - more resources