. 2025 Mar 4;16(1):2185.
doi: 10.1038/s41467-025-57404-6.

E3 ubiquitin ligase RNF128 promotes Lys63-linked polyubiquitination on SRB1 in macrophages and aggravates atherosclerosis

Affiliations

E3 ubiquitin ligase RNF128 promotes Lys63-linked polyubiquitination on SRB1 in macrophages and aggravates atherosclerosis

Yapeng Liu et al. Nat Commun. .

Abstract

Macrophage-derived foam cell formation is the hallmark of atherosclerotic plaques prominently attributed to excessive lipid uptake and metabolic disorders. As a classic membrane-localized ubiquitin ligase, the role of RNF128 in atherosclerosis remains unknown. We discover that RNF128 is specifically expressed in macrophages of the lipid core based on single-cell RNA sequencing data and persistent hyperlipidemia induces the high expression of RNF128 in macrophages. RNF128 ablation in macrophages ameliorates atherosclerosis in both male and female mice under the background of ApoE and LDLR deficiency. Mechanistically, RNF128 directly binds to scavenger receptor B1 (SRB1), preventing its degradation through the lysosomal system and promoting oxidized low-density lipoprotein (oxLDL)-induced foam cell formation and inflammatory response in macrophages. In addition, RNF128 catalyzes Lys63-linked polyubiquitination on the cytoplasmic C-terminus of the SRB1 at lysine 478, which promotes the endosome SRB1 recycling to the cell membrane with the assistance of Rab11, instead of entering the lysosome for degradation.


Conflict of interest statement

Competing interests: The authors declare no competing interests.

Figures
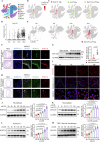
Fig. 1
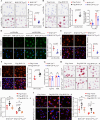
Fig. 1. The expression of RNF128 in macrophages is augmented during atherogenesis.
A Subset of cells from atherosclerotic aortas was annotated into nine clusters. B Location of cell clusters with Rnf128 expression on the t-SNE plot. C Cell clusters with the expression of Rnf128 (Rnf128+Mφ, left), high expression of Lyz2 (Lyz2hiMφ, middle), and both of these two genes (Rnf128+Lyz2hiMφ, right). Mφ, macrophages. D The expression level of Rnf128-expressing macrophage numbers during the process of atherosclerosis. E The number of macrophages with high expression of Rnf128 and Lyz2 in atherosclerotic aortas of mice fed WD for different durations. F Colocalization analysis via immunofluorescence of RNF128 and MOMA-2 (specific for monocytes and macrophages) expression in early and advanced atherosclerotic lesions of apolipoprotein E null (ApoE−/−) mice fed a WD for 8 weeks and 20 weeks, respectively (n = 8 per group, hereafter n = 8). Scale bar: 100 µm. G Western blotting images of RNF128 protein levels from whole aortas and quantitative analysis (n = 6). H Colocalization analysis of RNF128 and MOMA-2 expression in early and advanced atherosclerotic lesions from coronary atheromatous plaques of humans (n = 8). Scale bar: 100 µm. I Immunofluorescence of RNF128 in macrophages incubated with oxidized low-density lipoprotein (oxLDL, 75 µg/mL) for different time points (n = 6). Scale bar: 20 µm. J Western blotting (left, n = 4) and quantitative PCR (right, n = 6) of RNF128 expression in macrophages treated with oxLDL for different time points. K Western blotting (left, n = 4) and quantitative PCR (right, n = 6) of RNF128 expression in macrophages treated with a concentration gradient of oxLDL for 24 h. L, M Western blotting (left, n = 4) and quantitative PCR analysis (right, n = 6) of RNF128 expression in RAW264.7 and THP-1-derived macrophages treated with time-dependent oxLDL, respectively. The “n” represents the number of biologically independent samples. Data were presented as mean ± SD, Shapiro–Wilk method tested that all data were normally distributed. Unpaired two-tailed Student’s t-test was used for (G). One-way ANOVA followed by the Dunnett post hoc test was used for the others. Adjusted P values were provided in case of multiple-group comparisons. Source data are provided as a Source Data file.
Fig. 2
Fig. 2. Macrophage-specific deletion of RNF128 attenuates foam cell formation via reducing lipid uptake.
A Oil Red O staining of macrophages derived from RNF128fl/flLyz2cre mice (macrophage-specific conditional RNF128 knockout) and RNF128fl/fl mice (the control group) incubated with oxLDL (75 µg/mL) (left). Quantitative analysis was shown (right, n = 6). Scale bar: 20 µm. B Oil Red O staining of macrophages overexpressed with Flag-RNF128 or a control vector incubated with oxLDL (left). Quantitative analysis was shown (right, n = 6). Scale bar: 20 µm. C Total cholesterol content of macrophages from RNF128fl/flLyz2cre mice and RNF128fl/fl mice incubated with oxLDL (n = 6). D Neutral lipid dyed with boron-dipyrrolemethene (BODIPY) of macrophages isolated from RNF128fl/flLyz2cre mice and RNF128fl/fl mice with oxLDL (left). Quantitative analysis was shown (right, n = 6). Scale bar: 20 µm. E Macrophages derived from RNF128fl/flLyz2cre mice and RNF128fl/fl mice were treated with oxLDL labeled by red fluorescent probe (Dil-oxLDL) (20 µg/mL) for 6 h. Representative images of Dil-oxLDL uptake and quantitative intensity analysis was shown (n = 6). Scale bar: 20 µm. F Representative images of Dil-oxLDL uptake and quantitative intensity analysis in macrophages overexpressed with Flag-RNF128 or a control vector (n = 6). Scale bar: 20 µm. G Cholesterol efflux assay of macrophages derived from RNF128fl/flLyz2cre mice and RNF128fl/fl mice with Apolipoprotein A-I (ApoAI) and high-density lipoprotein (HDL) incubation, respectively (n = 6). H, I Macrophages derived from RNF128fl/flLyz2cre mice and RNF128fl/fl mice were overexpressed with Flag-RNF128, Flag-RNF128 ∆R or a control vector. Images of Oil Red O staining (H with oxLDL stimulation for 24 h) and uptake assay (I with Dil-oxLDL treatment for 6 h). Quantitative analysis was shown (n = 6). Scale bar: 20 µm. The “n” represents the number of biologically independent samples. Data were presented as mean ± SD, normal distribution was tested by Shapiro–Wilk method. Two-way ANOVA followed by Tukey post hoc test was used for (H). Mann–Whitney test (two-tailed) was used for (C, G). Kruskal–Wallis test followed by a Dunn test was used for (I). Unpaired two-tailed Student’s t-test was used for the others. ns not significant. Source data are provided as a Source Data file.
Fig. 3
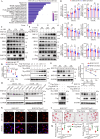
Fig. 3. RNF128 deficiency downregulates SRB1 protein level and inhibits foam cell formation.
A Kyoto Encyclopedia of Genes and Genomes (KEGG) pathway enrichment focusing on RNF128+Lyz2hi macrophages. B Quantitative PCR analysis of indicated gene expression in macrophages from RNF128-CKO and RNF128-WT mice after oxLDL stimulation. Target gene expression was normalized to Actin mRNA level (n = 6). C Western blotting images of indicated proteins from different groups. GAPDH was used for normalization (n = 4). D Quantitative analysis of SRB1 protein level in Fig. 3C (n = 4). E Western blotting analysis of indicated proteins with or without RNF128 overexpression (n = 4). F Western blotting images of indicated proteins in HEK293T cells transfected with a concentration gradient of Flag-RNF128. Cells in each sample were transfected with the same amount of plasmids coding for Myc-SRB1. Similar results were repeated independently for four times. G Western blotting images of indicated proteins and the statistical quantification (n = 4). H Western blotting images of indicated proteins in macrophages from RNF128-CKO and WT mice, which were treated with different inhibitors for 6 h after oxLDL treatment for 12 h (n = 4). I Western blotting images of indicated proteins in HEK293T cells transfected with plasmids encoding Myc-SRB1 along with the control vector, wild-type Flag-RNF128 or Flag-RNF128 ∆R (n = 4). J Western blotting images of indicated proteins in macrophages from different groups (n = 4). K Representative images of macrophages from RNF128fl/flLyz2cre mice and RNF128fl/fl mice with or without Flag-SRB1 overexpression. Scale bar: 20 μm. L Oil Red O staining of macrophages from indicated groups incubated with oxLDL for 24 h (n = 6). Scale bar: 20 μm. M Data analysis of (K, left) and (L, right). The “n” represents the number of biologically independent samples. Data were presented as mean ± SD, normal distribution was tested by Shapiro–Wilk method. Adjusted P values for (A) were determined using a two-tailed test. Two-way ANOVA followed by Tukey post hoc test was used for (B, G, M, right). Mann–Whitney test (two-tailed) was used for (D, M, left). Adjustments were made for multiple comparisons. Source data are provided as a Source Data file.
Fig. 4
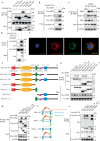
Fig. 4. RNF128 interacts with the extracellular region of SRB1 protein via the PA domain.
A Co-immunoprecipitation (Co-IP) analysis of HEK293T cells co-transfected with a green fluorescent protein (GFP)-tagged RNF128 and Flag-tagged ABCG1, SRA1, SRB1, CD36, CD68 to examine the interactors of RNF128. Co-IP of whole cell lysates was immunoprecipitated using Flag beads. B Co-IP assay of HEK293T cells co-transfected with Myc-SRB1 and Flag-RNF128. Co-IP was performed using Flag beads. C Western blotting images of indicated proteins of endogenous Co-IP in macrophages immunoprecipitated with anti-RNF128 or rabbit IgG antibody under oxLDL (75 µg/mL) stimulation for different time points. D In vitro Co-IP analysis of RNF128-SRB1 interaction using purified recombinant proteins including Glutathione S-transferase (GST)-tagged RNF128 and His-tagged SRB1. E Representative confocal microscopic images of colocalization between RNF128 and SRB1 in HeLa cells co-transfected with GFP-tagged RNF128 and mCherry-tagged SRB1. Scale bar: 10 µm. F Schematic diagram of wild-type Flag-RNF128 and its truncated mutants. G, H Co-IP analysis of the interaction between Myc-SRB1 with Flag-RNF128 and its truncated forms in HEK293T cells. I Schematic diagram of Myc-SRB1 and its truncated mutants. J Co-IP analysis of the interaction between Flag-RNF128 with Myc-SRB1 and its truncated forms in HEK293T cells. Each experiment was repeated independently with similar results four times. Source data are provided as a Source Data file.
Fig. 5
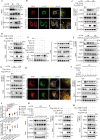
Fig. 5. RNF128 catalyzes K63-linked polyubiquitin chains of SRB1 at lysine 478.
A Co-IP analysis of SRB1 ubiquitination in HEK293T cells transfected with Myc-tagged SRB1 (Myc-SRB1), Flag-tagged RNF128 (Flag-RNF128) and hemagglutinin (HA)-tagged ubiquitin (Ub) and mutant ubiquitin (K48 and K63). B Co-IP analysis of SRB1 ubiquitination in HEK293T cells transfected with plasmids encoding Myc-SRB1 and HA-K63, as well as a control vector or plasmids encoding Flag-RNF128, Flag-RNF128 ∆R or point mutant RNF128 C2A. C Co-IP analysis of endogenous SRB1 ubiquitination in macrophages from RNF128-CKO and RNF128-WT mice with or without oxLDL (75 µg/mL) stimulation for 12 h. D In vitro SRB1-ubiquitination assay with purified recombinant proteins including glutathione S-transferase (GST)-tagged RNF128 and His-tagged SRB1 in the presence of E1, E2 (UbcH5a), ubiquitin (wildtype), ubiquitin (K63), or ubiquitin (K48). E Co-IP analysis of SRB1 ubiquitination in HEK293T cells transfected with HA-K63, Flag-RNF128 or a control vector in the presence of Myc-SRB1 and its mutants including SRB1-∆N and SRB1-∆C. F, G Co-IP analysis of the polyubiquitination of Myc-SRB1, its C- (F) and N-terminal (G) mutants in HEK293T cells co-transfected with HA-K63, Flag-RNF128 or a control vector. H Co-IP analysis of the polyubiquitination of Myc-SRB1 and its mutants in HEK293T cells co-transfected with plasmids encoding HA-K63, Flag-RNF128, or a control vector. I Co-IP analysis of endogenous SRB1 ubiquitination in macrophages from RNF128-CKO and RNF128-WT mice with Flag-RNF128 or Flag-RNF128 ∆R overexpression with oxLDL treatment. Each experiment was repeated independently with similar results four times. Source data are provided as a Source Data file.
Fig. 6
Fig. 6. RNF128-mediated ubiquitination of SRB1 promotes its recycling to the membrane via Rab11.
Plasma membrane (MEM) SRB1 refers to membrane SRB1 proteins purified using avidin from biotin-labeled membranes. Total SRB1 includes both membrane SRB1 and plasma SRB1 proteins, which are extracted from the whole lysate supernatant prior to avidin selection. A Western blotting analysis of total and MEM SRB1 in macrophages from RNF128-CKO and RNF128-WT mice with oxLDL stimulation. Sodium potassium ATPase (Na+/K+ ATPase) was used as a loading control for membrane protein (n = 4). B Laser confocal microscopy images of HeLa cells co-expressing either vector or Flag-tagged RNF128 with mCherry-tagged SRB1. Membrane SRB1 was marked by a yellow arrow (n = 4). Scale bar: 10 µm. C Western blotting analysis of indicated proteins immunoprecipitated with anti-LAMP2 or IgG antibody (n = 4). D Western blotting analysis of total and membrane proteins in HEK293T cells transfected with indicated plasmids (n = 4). E Western blotting analysis of total and membrane proteins in HEK293T cells (n = 4). F Western blotting analysis of indicated groups in macrophages immunoprecipitated with anti-Rab11 or rabbit IgG antibody (n = 4). G Western blotting analysis of indicated proteins in macrophages with Flag-RNF128 or vector overexpression immunoprecipitated with anti-Rab11 or rabbit IgG antibody (n = 4). H Confocal microscopy images of HeLa cells co-expressing either vector or Flag-tagged RNF128 with mCherry-SRB1 for 24 h. The colocalization of SRB1 and Rab11 was detected (n = 4). Scale bar: 10 µm. I Western blotting analysis of indicated proteins in macrophages immunoprecipitated with anti-Rab11 or rabbit IgG antibody (n = 4). J Quantification of SRB1 immunoprecipitated with anti-Rab11 antibody in I (upper) and total SRB1 protein of whole cell lysates in I (bottom) (n = 4). K Western blotting analysis of total and membrane proteins in macrophages incubated with DMSO, CQ, 3-MA, or leupeptin after oxLDL stimulation (n = 4). L, M Western blotting analysis of indicated groups in HEK293T cells immunoprecipitated with anti-Rab11 antibody (n = 4). The “n” represents the number of biologically independent samples. Data were presented as mean ± SD. Unpaired two-tailed Student’s t-test was used for (J). ns not significant. Source data are provided as a Source Data file.
Fig. 7
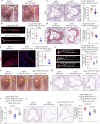
Fig. 7. Macrophage-specific deletion of RNF128 ameliorates atherosclerosis (males).
A Representative in situ images of the aortic arch with atherosclerotic plaques (yellow arrows) from ApoE−/−RNF128fl/flLyz2cre mice and ApoE−/−RNF128fl/fl mice fed a Western diet for 20 weeks (n = 12). B En face Oil red O staining of whole aortas (left) and data analysis (right). Plaque area was quantified as the percentage of lesion area/total surface area of the aorta (n = 6). C Hematoxylin-eosin (H&E) staining of cross sections at the aortic root (left) and data analysis (right). Atherosclerotic plaques were demarcated by black dashed lines (n = 10). Scale bar: 100 µm. D Oil red O staining of aortic root sections (left) and data analysis (right). Lesion size was quantified as the percentage of lesion area/lumen area (n = 10). Scale bar: 100 µm. E SRB1 protein identified by immunofluorescent staining in aortic root lesions (left) and data analysis (right). Atherosclerotic plaques were demarcated by white dashed lines (n = 10). Scale bar: 100 µm. F Representative in situ images of aortic arch with atherosclerotic plaques (yellow arrows) from ApoE−/−RNF128fl/flLyz2cre mice, ApoE−/−RNF128fl/fl mice, and ApoE−/−RNF128fl/flLyz2cre + SRB1 Lyz2-AAV mice fed a Western diet for 20 weeks (n = 6). G En face Oil red O staining of whole aortas (left) and data analysis (right). Plaque area was quantified as the percentage of lesion area/total surface area of the aorta (n = 6). H Hematoxylin-eosin (H&E) staining of cross sections at the aortic root. Atherosclerotic plaques were demarcated by black dashed lines. Scale bar: 100 µm. I Data analysis of (H) (n = 6). J Oil red O staining of aortic root sections (left) and data analysis (right). Lesion size was quantified as the percentage of lesion area/lumen area (n = 6). Scale bar: 100 µm. Data were presented as mean ± SD. Normal distribution was tested by the Shapiro–Wilk method. Unpaired two-tailed Student’s t-test was used for (BE). The “n” represents the number of biologically independent samples. One-way ANOVA followed by the Dunnett post hoc test was used for the others. Source data are provided as a Source Data file.

References

    1. Libby, P. The changing landscape of atherosclerosis. Nature592, 524–533 (2021). - PubMed
    1. Wang, J. K. et al. Ablation of plasma prekallikrein decreases low-density lipoprotein cholesterol by stabilizing low-density lipoprotein receptor and protects against atherosclerosis. Circulation145, 675–687 (2022). - PubMed
    1. Brophy, M. L. et al. Myeloid-specific deletion of Epsins 1 and 2 reduces atherosclerosis by preventing LRP-1 downregulation. Circ. Res.124, e6–e19 (2019). - PMC - PubMed
    1. Collaborators, G.B.D.C.o.D. Global, regional, and national age-sex-specific mortality for 282 causes of death in 195 countries and territories, 1980-2017: a systematic analysis for the Global Burden of Disease Study 2017. Lancet392, 1736–1788 (2018). - PMC - PubMed
    1. Robinson, J. G. & Gidding, S. S. Curing atherosclerosis should be the next major cardiovascular prevention goal. J Am. Coll. Cardiol.63, 2779–2785 (2014). - PubMed

MeSH terms