Clinical Trial
. 2025 Mar 4;16(1):2195.
doi: 10.1038/s41467-025-57293-9.

Determinants of response and molecular dynamics in HER2+ER+ breast cancers from the NA-PHER2 trial receiving HER2-targeted and endocrine therapies

Affiliations
Clinical Trial

Determinants of response and molecular dynamics in HER2+ER+ breast cancers from the NA-PHER2 trial receiving HER2-targeted and endocrine therapies

Maurizio Callari et al. Nat Commun. .

Abstract

Improved outcomes in HER2+ female breast cancer have resulted from chemotherapy and anti-HER2 therapies. However, HER2+ER+ cancers exhibit lower response rates. The phase 2 NA-PHER2 trial (NCT02530424) investigated chemo-free preoperative HER2 blockade (trastuzumab + pertuzumab) and CDK4/6 inhibition (palbociclib) with or without endocrine therapy (fulvestrant) in HER2+ER+ breast cancer. Clinical endpoints (i.e. Ki67 dynamics and pathological complete response) were previously reported. Here we report on the biomarker analysis, secondary objective of the study. Through RNA sequencing and tumour infiltrating lymphocytes (TIL) assessment in serial biopsies, we identified biomarkers predictive of pCR or Day14 Ki67 response and unveiled treatment-induced molecular changes. High immune infiltration and low ER signalling correlated with pCR, while TP53 mutations associated with high Day14 Ki67. Stratification based on Ki67 at Day14 and at surgery defined three response groups (Ki67 HighHigh, LowHigh, LowLow), with divergent tumour and stroma expression dynamics. The HighHigh group showed dysfunctional immune infiltration and overexpression of therapeutic targets like PAK4 at baseline. The LowLow group exhibited a Luminal A phenotype by the end of treatment. This study expands our understanding of drivers and dynamics of HER2+ER+ tumour response, towards treatment tailoring.


Conflict of interest statement

Competing interests: G.V. received grants/research supports from: Roche/Genentech, Ventana Medical Systems, Dako/Agilent Technologies; honoraria or consultation feesfrom: Ventana, Dako/Agilent, Roche, MSD Oncology, AstraZeneca, Daiichi Sankyo, Pfizer, Eli Lilly. All the authors declare no conflicts of interest. L.P. has received consulting fees and honoraria for advisory board participation from Pfizer, Astra Zeneca, Merck, Novartis, Bristol-Myers Squibb, Stemline-Menarini, GlaxoSmithKline, Genentech/Roche, Personalis, Daiichi, Natera, Exact Sciences and institutional research funding from Seagen, GlaxoSmithKline, AstraZeneca, Merck, Pfizer and Bristol Myers Squibb. M.Co. received an institutional research grant from Roche. G.B. reports personal fees for consultancy/honorarium/advisory role: Lilly, Novartis, Pfizer, Roche, AstraZeneca, Amgen, MSD, Chugai, Sanofi, Daiichi Sankyo, EISAI, Gilead, Menarini/stemline, Exact Science, Seagen, Agendia; institutional fee for research grant from Gilead. L.G. reports grants from Roche, Breast Cancer Research Foundation (BCRF), and Pfizer during the conduct of the study; personal fees from AstraZeneca, Ely Lilly and Company, Roche, Pfizer, Seattle Genentics, Artemida Pharma, Synaffix, Menarini Ricerche, and Biomedical Insights; grants and personal fees from Zymeworks and Revolution Medicine; other support from METIS Precision Medicine, Amgen, and QU Biologics outside the submitted work; in addition, L.G. has a patent for EU N. 12195182 issued and a patent for EU N.12196177.5 issued.

Figures
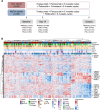
Fig. 1
Fig. 1. Translational research on the NA-PHER2 trial.
A Schematic representation of the NA-PHER2 trial and associated serial sample collection. The number of samples for which RNA sequencing (RNA-seq), Ki67 quantification and TIL scoring were performed are indicated for each timepoint. B Annotated heatmap of 904 most expressed and variant genes. sTILs = stromal tumour infiltrating lymphocytes; iTILs = intra-tumoral infiltrating lymphocytes; pCR = pathologic complete response; RD = residual disease. Source data are provided as a Source Data file.
Fig. 2
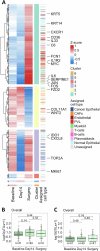
Fig. 2. Association of molecular features with pCR.
A Heatmap of differentially expressed genes showing association with pCR (* = FDR < 10%) compared to patients with residual disease (RD) in at least one of the indicated comparisons. The association was evaluated in the overall population and separately for the two trial cohorts and using either baseline or Day14 measurements. Manually selected representative genes are highlighted. Gene to cell type annotation based on an external HER2+ scRNA-seq dataset is reported. Genes are assigned to a specific cell type when their expression is significantly higher in that cell type according to the interrogated single-cell dataset. Unassigned genes are in grey, genes not measured/expressed in the single cell dataset are in white; see Methods for details. An extended version reporting all the gene symbols is presented in Supplementary Fig. 3. B Heatmap of representative manually selected genesets showing a positive or negative enrichment in patients achieving pCR compared to RD (* = FDR < 0.1%). A comprehensive list of all significant genesets is presented in Supplementary Fig. 4A. C Scatterplot of ESR1 and B2M expression at baseline in the overall population. Dashed lines indicate the first tertile and the median value for ESR1 and B2M respectively. D Area under the ROC curve (AUC) distribution after fitting 100 internally cross-validated regularized logistic regression models using either baseline or Day14 gene expression as candidate features to predict pCR. AUC distributions were compared using two-sided Student’s t-test. E Association with pCR for the PAM50 subtypes defined at baseline, two-sided Fisher’s test. F Association between presence of PIK3CA (top) or TP53 (bottom) mutation and pCR, two-sided Fisher’s test. G Association of sTILs with pCR in the overall population and per treatment cohort, quantified either at baseline or in Day14 biopsy, two-sided Student’s t-test. H Association of iTILs with pCR in the overall population and per treatment cohort, quantified either at baseline or in Day14 biopsy, two-sided Student’s t-test. All boxplots are defined as follow: centre line = median; box limits = upper and lower quartiles; whiskers = 1.5x interquartile range; points = outliers. sTILs = stromal tumour infiltrating lymphocytes; iTILs = intra-tumoral infiltrating lymphocytes; pCR = pathologic complete response; RD = residual disease; NES = Normalised Enrichment score. Source data are provided as a Source Data file.
Fig. 3
Fig. 3. Association of baseline molecular features with Ki67 at Day14.
A Differences in Ki67 dynamics during treatment in the Fulv and NoFulv cohorts, two-sided Student’s t-test. B Evaluation of differences in Ki67 positivity in tumours from patients achieving or not pCR (overall cohort), two-sided Student’s t-test. C Selected genesets with a significant enrichment in the Day14 Ki67 high group (i.e. Ki67 > 10%) compared to low (i.e. Ki67 ≤ 10%), * = gene permutation FDR < 0.1%). D Association of PAM50 subtypes defined at baseline with Day14 Ki67, two-sided Fisher’s test. E Association between presence of PIK3CA mutation and Day14 Ki67, two-sided Fisher’s test. F Association between presence of TP53 mutation and Day14 Ki67, two-sided Fisher’s test. G Association of baseline sTILs with Day14 Ki67 in the overall population and per treatment cohort, two-sided Student’s t-test. H Association of baseline iTILs with Day14 Ki67 in the overall population and per treatment cohort, two-sided Student’s t-test. All boxplots are defined as follow: centre line = median; box limits = upper and lower quartiles; whiskers = 1.5x interquartile range; points = outliers. sTILs = stromal tumour infiltrating lymphocytes; iTILs = intra-tumoral infiltrating lymphocytes; pCR = pathologic complete response; RD = residual disease; NES = Normalised Enrichment score. Source data are provided as a Source Data file.
Fig. 4
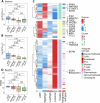
Fig. 4. Early treatment-induced molecular changes.
A Heatmap of genes differentially expressed at Day14 compared to baseline. The comparison was carried out in the overall population and separately for the two trial cohorts. Manually selected representative genes are highlighted. Gene to cell type annotation based on an external HER2+ scRNA-seq dataset is reported. Only genes with |logFC | >1 are reported, * = FDR < 10%. An extended version, reporting all genes with FDR < 10% in at least one comparison, is presented in Supplementary Fig. 8. B Heatmap of genesets significantly enriched in either the overall population or one of the two treatment cohorts, * = gene permutation FDR < 0.1%. C Evaluation of changes in sTILs at Day14 compared to baseline in the overall population and separately for the Fulv and NoFulv cohorts, two-sided Student’s t-test. D Evaluation of changes in iTILs at Day14 compared to baseline in the overall population and separately for the Fulv and NoFulv cohorts, two-sided Student’s t-test. All boxplots are defined as follow: centre line = median; box limits = upper and lower quartiles; whiskers = 1.5x interquartile range; points = outliers. sTILs = stromal tumour infiltrating lymphocytes; iTILs = intra-tumoral infiltrating lymphocytes. Source data are provided as a Source Data file.
Fig. 5
Fig. 5. Treatment induced changes in tumours from patients with residual disease at surgery.
A Heatmap of genes differentially expressed in a cohort-adjusted time course analysis. Six distinct patterns were identified by clustering analysis and manually selected representative genes are indicated. Gene to cell type annotation based on an external HER2+ scRNA-seq dataset is reported. An extended version reporting all the gene symbols is presented in Supplementary Fig. 10. B Evaluation of changes in sTIL levels during neoadjuvant treatment in the subgroup of patients with residual disease at surgery, two-sided Student’s t-test. C Evaluation of changes in iTIL levels during neoadjuvant treatment in the subgroup of patients with residual disease at surgery, two-sided Student’s t-test. All boxplots are defined as follow: centre line = median; box limits = upper and lower quartiles; whiskers = 1.5x interquartile range; points = outliers. sTILs = stromal tumour infiltrating lymphocytes; iTILs = intra-tumoral infiltrating lymphocytes. Source data are provided as a Source Data file.
Fig. 6
Fig. 6. Gene expression and TIL changes during neoadjuvant treatment in patients with residual disease at surgery stratified by Ki67 dynamics.
A Heatmap of genes differentially expressed in a time course analysis comparing Ki67 LowLow, LowHigh and HighHigh groups. Nine distinct patterns were identified and representative genes indicated. Gene to cell type annotation based on an external HER2+ scRNA-seq dataset is reported. An extended version reporting all the gene symbols is presented in Supplementary Fig. 12. B Evaluation of sTIL levels in the three groups defined by Ki67 dynamics at baseline, Day14 and surgery, two-sided Student’s t-test. C Evaluation of iTIL levels in the three groups defined by Ki67 dynamics at baseline, Day14 and surgery, two-sided Student’s t-test.All boxplots are defined as follow: centre line = median; box limits = upper and lower quartiles; whiskers = 1.5x interquartile range; points = outliers. sTILs = stromal tumour infiltrating lymphocytes; iTILs = intra-tumoral infiltrating lymphocytes. Source data are provided as a Source Data file.
Fig. 7
Fig. 7. Differential analysis between four distinct response groups.
Response to treatment was stratified in four distinct groups: the pCR group and three groups with residual disease at surgery but with distinct Ki67 levels defined by Day14 and surgery Ki67 (i.e. HighHigh, LowHigh, LowLow). A Comparison of sTIL levels between the four response groups. Differences were evaluated by two-sided Student’s t-test. B Comparison of iTIL infiltration between the four response groups. Differences were evaluated by two-sided Student’s t-test. C Heatmap of differentially expressed genes across the four groups. Annotation of the cell type prevalently expressing each gene is reported, when available in the HER2+ single-cell dataset. Four gene clusters were identified by unsupervised analysis and manually selected genes are highlighted. An extended version of the heatmap is reported as Supplementary Fig. 14. D Comparison of HER2 expression levels in the four response groups. Differences were evaluated by two-sided Student’s t-test. All boxplots are defined as follow: centre line = median; box limits = upper and lower quartiles; whiskers = 1.5x interquartile range; points = outliers. sTILs = stromal tumour infiltrating lymphocytes; iTILs = intra-tumoral infiltrating lymphocytes. Source data are provided as a Source Data file.

References

    1. Loibl, S. & Gianni, L. HER2-positive breast cancer. Lancet389, 2415–2429 (2017). - PubMed
    1. Brandão, M. et al. What is the real impact of estrogen receptor status on the prognosis and treatment of HER2-Positive Early Breast Cancer? Clin. Cancer Res.26, 2783–2788 (2020). - PMC - PubMed
    1. Bianchini, G. et al. Immune modulation of pathologic complete response after neoadjuvant HER2-directed therapies in the NeoSphere trial. Ann. Oncol.26, 2429–2436 (2015). - PubMed
    1. Gianni, L. et al. Neoadjuvant and adjuvant trastuzumab in patients with HER2-positive locally advanced breast cancer (NOAH): Follow-up of a randomised controlled superiority trial with a parallel HER2-negative cohort. Lancet Oncol.15, 640–647 (2014). - PubMed
    1. Gianni, L. et al. 5-year analysis of neoadjuvant pertuzumab and trastuzumab in patients with locally advanced, inflammatory, or early-stage HER2-positive breast cancer (NeoSphere): a multicentre, open-label, phase 2 randomised trial. Lancet Oncol.17, 791–800 (2016). - PubMed

Publication types

MeSH terms