. 2025 Mar 4;16(1):2151.
doi: 10.1038/s41467-025-57468-4.

Follicular regulatory T cells restrain kidney allograft rejection in mice by suppressing alloreactive B cells

Affiliations

Follicular regulatory T cells restrain kidney allograft rejection in mice by suppressing alloreactive B cells

Hengcheng Zhang et al. Nat Commun. .

Abstract

Pathogenic antibodies produced by alloreactive B cells mediate antibody-mediated rejection after kidney transplantation, but the mechanisms remain poorly understood. Follicular regulatory T (Tfr) cells modulate follicular helper T cell-mediated B cell responses, but the functions of Tfr in controlling alloreactive antibody are unknown. Here we study the developmental signals and functions of Tfr cells in mouse allogeneic kidney transplantation models, and show that costimulatory blockade alters the development of Tfr cells disproportionately by decreasing germinal center (GC)-like Tfr cells but increasing follicular-like Tfr cells. Functionally, global Tfr cell deletion results in accelerated graft rejection and increases in donor-specific B cells in both draining lymph nodes and kidney allografts. Mechanistically, Tfr cell deletion increases GC B cell expression of pro-inflammatory cytokines such as IL-15, while neutralization of IL-15 compensates for the loss of Tfr cells and prolongs the survival of mice receiving kidney transplants. Together our preclinical mouse data demonstrate how Tfr restrains kidney allograft rejection by limiting alloreactive B cell responses.


Conflict of interest statement

Competing interests: The authors declare no competing interests.

Figures
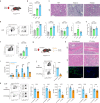
Fig. 1
Fig. 1. Costimulatory blockade dampens Tfr cell differentiation after allogeneic kidney transplantation.
a Schematic of kidney transplantation. Balb/c (allogeneic) or C57BL/6 (syngeneic) underwent kidney transplantation into FoxP3 reporter mice. Recipients were harvested 20 days post-transplantation to assess immune response and graft rejection. b The levels of DSA IgG in the serum were measured by flow cytometry and presented as MFI (n = 4 for the Syn and POD20 group, n = 5 for the POD10 group). POD: post-operative day. MFI: mean fluorescence intensity. c Representative histological images of kidney grafts at postoperative day 20. Magnification: 200×, scale bars: 50 μm. d. Gating strategy (left) and quantification (right) of follicular CXCR5+ T, Tfh (gated as CD4+CD19-CXCR5+FoxP3-), and Tfr (gated as CD4+CD19-CXCR5+FoxP3+) cells in the spleen and dLN. n = 4 for the Syn and POD20 group, n = 5 for the POD10 group. e Frequency of CD4+FoxP3+ Treg cells in total CD4+ T cells in the spleen and dLN (n=4 for the Syn and POD20 group, n = 5 for the POD10 group). f Gating strategy (left) was used to identify and quantify (right) CD19+GL7+FAS+ germinal center (GC) B cells from dLNs. n = 4 for the Syn and POD20 group, n = 5 for the POD10 group. g Schematic of CTLA4Ig treatment after kidney transplantation. h Representative histological images of transplanted kidneys from CTLA4Ig treated mice are shown, stained with hematoxylin and eosin (HE) (Magnification: 200×, scale bars: 50 μm) and ABMR marker C4d (Magnification: 100×, scale bars: 100 μm). i IgG DSA levels at indicated time points from the experiment as in (g). n = 4 mice per group. Student’s two-tailed unpaired T-test was used to compare two groups. Bonferroni correction was used to control for multiple comparisons. j Gating strategy (left) and frequency (right) of GC B cells from dLNs with (n = 4) or without CTLA4Ig treatment (n = 5). k Gating strategy (left) and quantification (right) of follicular CXCR5+ T, Tfh (gated as CD4+CD19-CXCR5+FoxP3-), and Tfr (gated as CD4+CD19-CXCR5+FoxP3+) cells from dLNs (n = 5 for the No treatment and n = 4 for the CTLA4Ig group). Data is from one experiment and is representative of two independent experiments. Error bars show mean ± SEM. Student’s two-tailed unpaired T test (j, k), One-way ANOVA with Tukey’s multiple-comparison test (b, df). Source data are provided as a Source Data file. Portions created in BioRender. Zhang, H. (2025) https://BioRender.com/b29q775.
Fig. 2
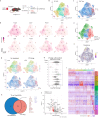
Fig. 2. The follicular to GC-like developmental transition in Tfr cells is sensitive to costimulatory blockade.
a Diagram of single-cell RNA sequencing experiment. Balb/c kidneys were transplanted into Foxp3IRES-GFP mice with or without CTLA4Ig treatment. Tfr (CD4+CXCR5+FoxP3+) and Treg (CD4+CXCR5-FoxP3+) cells from dLN were sorted and scRNAseq performed. b UMAP plot showing unsupervised clustering of all post-filter cells. The total number of cells analyzed is shown. c Cells in UMAP plot marked by cell type. d Feature plots showing the expression levels of indicated genes of interest across clusters. e Clusters annotated based on gene expression states, including Naïve-like, Follicular-like, and GC-like. f Monocle pseudotime analysis utilizing cluster 0 as the starting node and indicating developmental trajectories by lines and overall pseudotime by color, plotted within UMAP space. g. UMAP plot showing clustering (top) and cell type (bottom) for cells in no treatment or CTLA4Ig treated mice. Number of cells per group is indicated. h Cluster distribution changes analyzed with miloR package. Red dots indicate a reduced cell population while blue dots indicate an increased cell population with the CTLA4Ig treatment. i Heatmap showing top marker genes for each cluster compared to all clusters. j Volcano plot showing differentially expressed genes (DEGs) between clusters 3 and 4. DEGs were identified using a two-sided Wilcoxon rank-sum test, as implemented by the Seurat FindMarkers function (logFC threshold=0.1, min.pct=0.1). p-values were adjusted for multiple comparisons using the Bonferroni method. k Venn diagram showing differentially expressed genes between Tfr and Treg cells in control or CTLA4Ig treated group. Portions created in BioRender. Zhang, H. (2025) https://BioRender.com/b29q775.
Fig. 3
Fig. 3. Costimulatory blockade restricts Tfr clonal expansion.
a Clonal expansion indicated in UMAP space utilizing scRepertoire. Each dot represents an individual cell, with colors indicating the size of clonal expansion. Pink indicates singleton clones, while dark pink and red indicate small (1<x < =5) and medium (5<x < =20) clonal expansion, respectively. b Distribution of clonal expansion across experiment groups (left) and clusters (right). c Correlation of clonal expansion and sharing of clones between Tfr and Treg cells calculated by scRepertoire. Circled clones indicate shared clones. d Proportion of clonal sharing between cluster 0 and other clusters, with cluster 0 set as founder clones. The thickness of lines indicates magnitude of shared clones. e Circos plot showing sharing of expanded clones between clusters. Only expanded clones are included.
Fig. 4
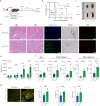
Fig. 4. Tfr cells prevent allo-antibody formation and rejection of kidney allografts.
a Schematic of Tfr cell deletion using Tfr-DTR mice. Control (Tfr-Con, Foxp3CreYFPCxcr5wt) or Tfr-DTR (Foxp3CreYFPCxcr5LoxSTOPLoxDTR) mice received diphtheria toxin (DT), CTLA4Ig (on day 2) and Balb/c kidneys as life-sustaining (b) or non-life-sustaining (cg) transplants. b Survival of transplanted recipients not receiving CTLA4Ig (no-treatment), or CTLA4Ig treated Tfr-Con or Tfr-DTR mice. MST, median survival time. c Spleens and kidney grafts from Tfr-Con and Tfr-DTR mice harvested 20 days after transplantation. d Representative histological images of kidney grafts at postoperative day 20, including hematoxylin and eosin (HE), immunohistochemistry staining for B220, and immunofluorescence staining for C4d and IgG. scale bars: 50 and 100 μm. e IgG DSA levels in serum at indicated time points. MFI=mean fluorescence intensity. n = 5 mice per group. f Allo-reactive IgG to individual MHC molecules measured by single antigen bead. Syn= syngeneic. n = 5 mice per group. g Quantification of serum autoantibody levels. Representative images of serum from mice as in (a) incubated with Hep-2 cells (left) and quantification of cumulative, cytoplasm, and nucleus antibody signal. n = 5 mice per group. Scale bars: 50 μm. Data is from one experiment and is representative of two independent experiments. Statistics: Error bars show mean ± SEM. Student’s two-tailed unpaired T test for 2-group comparisons and Kaplan-Meier survival analysis and a log-rank test for survival analysis (b). Source data are provided as a Source Data file. Portions created in BioRender. Zhang, H. (2025) https://BioRender.com/b29q775.
Fig. 5
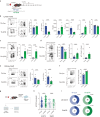
Fig. 5. Tfr cells restrain lymph node and intragraft germinal center B cell differentiation.
a Schematic of Tfr cell deletion using Tfr-DTR mice. Tfr-Con (Foxp3CreYFPCxcr5wt) or Tfr-DTR (Foxp3CreYFPCxcr5LoxSTOPLoxDTR) mice received diphtheria toxin (DT), CTLA4Ig (on day 2) and Balb/c kidneys. b Gating strategy and quantification of CXCR5+ follicular T, Tfh (gated as CD4+CD19-CXCR5+FoxP3-), Tfr (gated as CD4+CD19-CXCR5+FoxP3+), and CXCR5-FoxP3+ T cells in total CD4+ T cells from the dLNs. n = 4 mice for the Tfr-Con group and n = 5 for the Tfr-DTR group. c Gating strategy (left) and quantification (right) of CD19+GL7+FAS+ GC B cells. n = 4 mice for the Tfr-Con group and n = 5 for the Tfr-DTR group. d. Gating strategy (left) and quantification (right) of Naïve B cells (CD38+IgG1-CD19+), memory-like B cells (CD38+IgG1+CD19+), and IgG1+ B cells in the dLN (n = 4 for Tfr-Con and n = 5 for Tfr-DTR). e Gating strategy and quantification of Tfh and Tfr cells in kidney allografts (n = 4 for Tfr-Con and n = 5 for Tfr-DTR). f Gating strategy and quantification of GC-like B cells (GL7+CD19+) in kidney allografts. n = 4 mice for each group. g Schematic of GC B single cell culture assays. Single GC B cells from dLN or grafts were sorted and cultured with NB21 feeder cells for 6 days. Culture supernatants were pre-screened for IgG positivity and further assessed for DSA reactivity. h DSA signal of individual IgG+ clones from LN GC B and graft B cells from either control or Tfr-DTR mice 20 days after transplantation. The dotted line indicates the level of detection threshold assessed by signal using syngeneic cells. i Frequency of DSA clones (from all IgG+ clones). Numbers indicate the total number of IgG clones analyzed. Data is from one experiment and is representative of two independent experiments. Statistics: Error bars show mean ± SEM. Student’s two-tailed unpaired T test for 2-group comparisons. Source data are provided as a Source Data file. Portions created in BioRender. Zhang, H. (2025) https://BioRender.com/b29q775.
Fig. 6
Fig. 6. Intensified graft rejection after Tfr cell deletion does not require CD8 T cells.
a Schematic of experiment for which Tfr-Con or Tfr-DTR mice were administered a CD8 depleting antibody, CTLA4Ig, and diphtheria toxin (DT) to delete Tfr cells. Organs were harvested on day 20. b IgG DSA levels in the serum of Tfr-Con (n = 4) and Tfr-DTR (n = 3) mice from (a) at indicated time points (POD=post operative day). c Representative gating strategy and quantification of GL7+FAS+ GC B cells and IgG1+ GC B cells in dLNs of Tfr-Con (n = 4) and Tfr-DTR (n = 3) mice. d Representative gating strategy and quantification of GL7+ B cells in kidney grafts (n = 4 for Tfr-Con and n = 3 for Tfr-DTR). e Representative images of kidney grafts stained with HE (Magnification: 200×) or C4d (Magnification: 100×) for Tfr-Con and Tfr-DTR mice. f Schematic of assay to assess the ability of DSA from Tfr-Con or Tfr-DTR to mediate C4d deposition. B cell-deficient (μMT) mice were transplanted with a Balb/c kidney and serum from Tfr-Con or Tfr-DTR mice from (a) were passively transferred. Transplanted graft was harvested on day 10. g Representative images showing C4d and IgG deposition in kidney grafts from μMT mice as in (f). Magnification: 100×, scale bars: 100 μm. Data are combined from two independent experiments. Statistics: Error bars show mean ± SEM. Student’s two-tailed unpaired T test for 2-group comparisons. Source data are provided as a Source Data file. Portions created in BioRender. Zhang, H. (2025) https://BioRender.com/b29q775.
Fig. 7
Fig. 7. Tfr cells fail to control the later stages of rejection after kidney transplantation.
a Schematic of late Tfr cell deletion after allogeneic kidney transplantation. Tfr-Con or Tfr-DTR mice received Balb/c kidney transplants followed by CTLA4Ig treatment. Diphtheria toxin (DT) was administered starting on day 20 to induce Tfr cell deletion, and mice being analyzed 30 days post-transplantation. b Measurement of IgG DSA in the serum of Tfr-Con (n = 4) and Tfr-DTR (n = 3) mice at 30 days post-transplantation. c Pathology of transplanted kidneys using hematoxylin and eosin (HE) staining. Magnification: 200×, scale bars: 50 μm. d Gating strategy and quantification of CXCR5+ follicular, Tfh, Tfr, and CXCR5-Foxp3+ T cells in total CD4+ T cells from the dLNs of Tfr-Con (n = 5) and Tfr-DTR (n = 3) mice. e Gating strategy (left) and quantification (right) of GC B cells (n = 5 for Tfr-Con and n = 3 for Tfr-DTR). f Frequency of Naïve (CD38+IgG1-), IgG1+, IgG2+, and memory-like (CD38+IgG1+) B cells in total B cells from the dLN (n = 5 for Tfr-Con and n = 3 for Tfr-DTR). Data are combined from two independent experiments. Statistics: Error bars show mean ± SEM. Student’s two-tailed unpaired T test for 2-group comparisons. Source data are provided as a Source Data file. Portions created in BioRender. Zhang, H. (2025) https://BioRender.com/b29q775.
Fig. 8
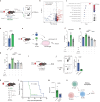
Fig. 8. Tfr cells dampen transplant rejection by limiting B cell production of IL-15.
a Diagram of bulk RNAseq experiment. CD19+GL7+FAS+ GC B cells from dLN were sorted from CTLA4Ig and DT treated Tfr-Con or Tfr-DTR recipients and RNAseq performed. b Volcano plot indicating differentially expressed genes (DEGs) between Tfr-Con and Tfr-DTR GC B cells as in (a). Genes with a P value < 0.05 are shown highlighted as upregulated (red) or downregulated (blue) in Tfr-DTR. c KEGG pathways associated with DEGs from (b). d Concentration of IL-15 from interstitial fluid of dLNs from Tfr-Con (n = 5) and Tfr-DTR (n = 4) mice, expressed as a relative value to protein concentration. e Schematic of in vitro Tfh-mediated B cell stimulation assay. Tfh, Tfr, and B cells from transplant recipients were cocultured for 4 days with anti-CD3/IgM in the presence or absence of 100 ng/ml anti-IL-15. f Quantification of IL-15 levels in the supernatant from the co-culture assay described in (e). g Percentage of GL7+ B cells in the presence of Tfh cells under indicated co-culture conditions. h Quantification of IgG in the culture supernatants from culture conditions. i Schematic of experiment to assess the role of IL-15Rα in B cell alloimmunity after kidney transplantation. IL-15Rα KO (Il15ra-/-) or control mice received Balb/c kidney transplants, and grafts were harvested on day 20 for analysis, n = 4 per group. j Gating strategy (left) and quantification (right) of GL7+ GC B cells in the dLNs as in (i). n = 4 per group. k Schematic of experiment to assess contribution of IL-15 to exacerbated rejection after Tfr-deletion. Tfr-DTR mice underwent Balb/c kidney transplantation and received CTLA4Ig and DT. Some mice further received anti-IL-15. Mice were either followed for survival or organs harvested on day 20 post-transplantation for analysis. l Kaplan-Meier survival curve of transplanted Tfr-DTR recipients with or without anti-IL-15 treatment as in (k). m Total IgG DSA from the serum of mice as in (k) 20 days after transplantation. n = 4 per group. n Model summarizing Tfr role in controlling kidney transplant rejection. Red arrow indicates effect of Tfr cells. (a-c, i, j) Data is combined from two experiments. (d-h, k-m) Data is from two experiments and is representative of two independent experiments. Statistics: Error bars show mean ± SEM. Student’s two-tailed unpaired T test (d, j, m), One-way ANOVA with Tukey’s multiple comparison test for f-h. Kaplan-Meier survival analysis, and a log-rank test for survival analysis (l). Source data are provided as a Source Data file. Portions created in BioRender. Zhang, H. (2025) https://BioRender.com/b29q775.

References

    1. Vanholder, R. et al. Organ donation and transplantation: a multi-stakeholder call to action. Nat. Rev. Nephrol.17, 554–568 (2021). - PMC - PubMed
    1. Zhang, H. et al. Transcriptionally Distinct B Cells Infiltrate Allografts After Kidney Transplantation. Transplantation107, e47–e57 (2023). - PMC - PubMed
    1. Gassen, R. B. et al. T cell depletion increases humoral response by favoring T follicular helper cells expansion. Am. J. Transpl.22, 1766–1778 (2022). - PMC - PubMed
    1. Wojciechowski, D. & Wiseman, A. Long-Term Immunosuppression Management: Opportunities and Uncertainties. Clin. J. Am. Soc. Nephrol.16, 1264–1271 (2021). - PMC - PubMed
    1. Mohiuddin, M. M. et al. Graft dysfunction in compassionate use of genetically engineered pig-to-human cardiac xenotransplantation: a case report. Lancet402, 397–410 (2023). - PMC - PubMed

LinkOut - more resources