. 2025 Mar 4;15(1):7618.
doi: 10.1038/s41598-025-91331-2.

Enhancing radiation-induced reactive oxygen species generation through mitochondrial transplantation in human glioblastoma

Affiliations

Enhancing radiation-induced reactive oxygen species generation through mitochondrial transplantation in human glioblastoma

Kent L Marshall et al. Sci Rep. .

Abstract

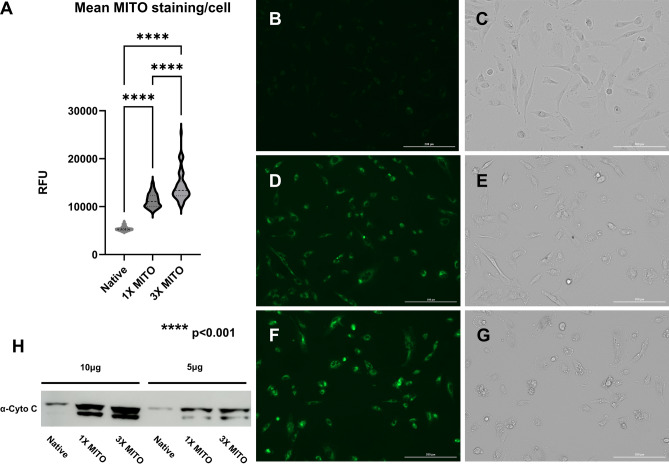
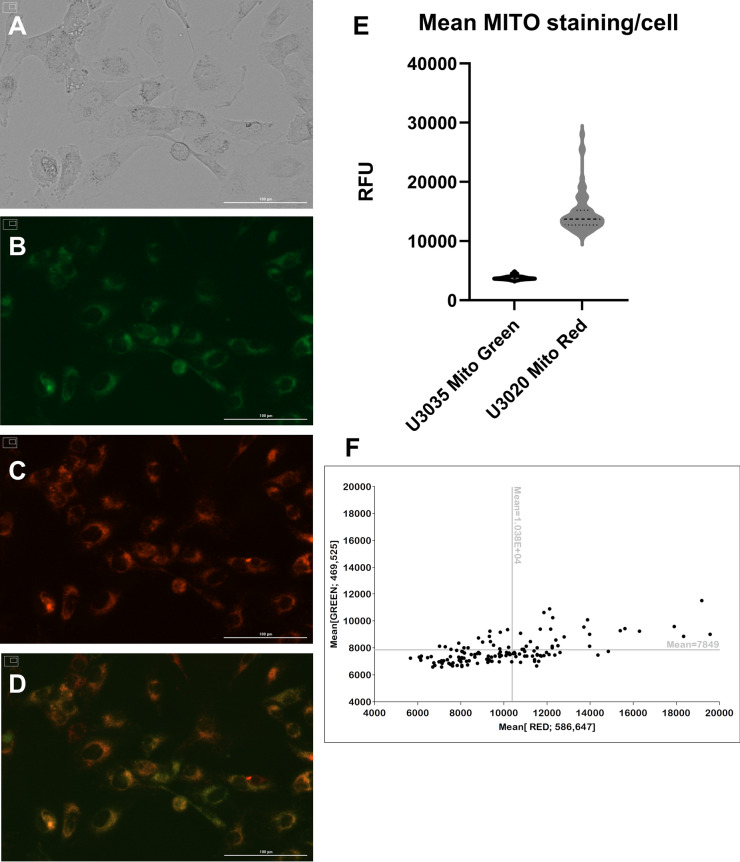
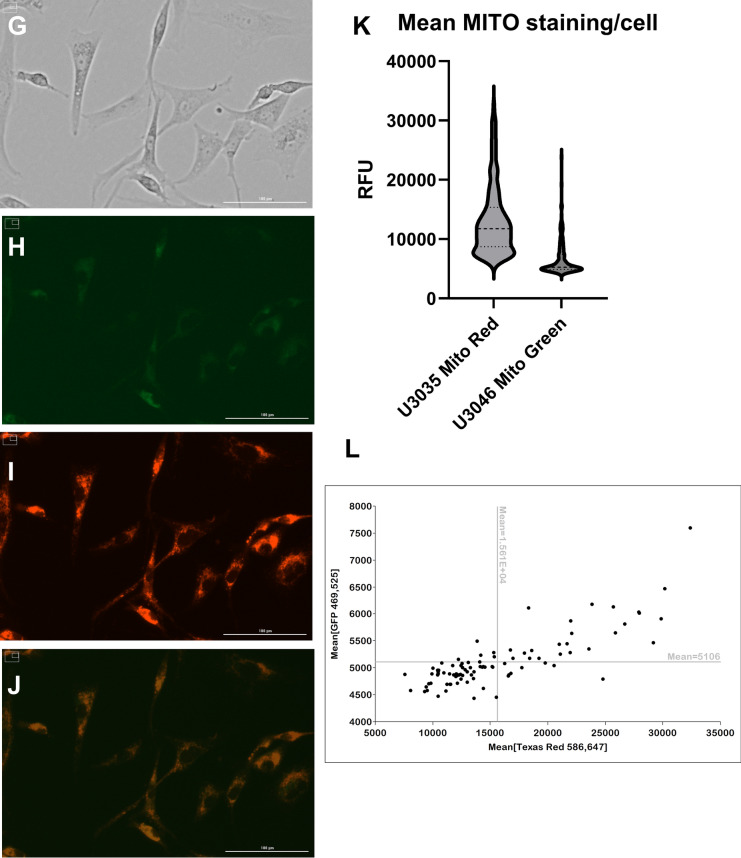
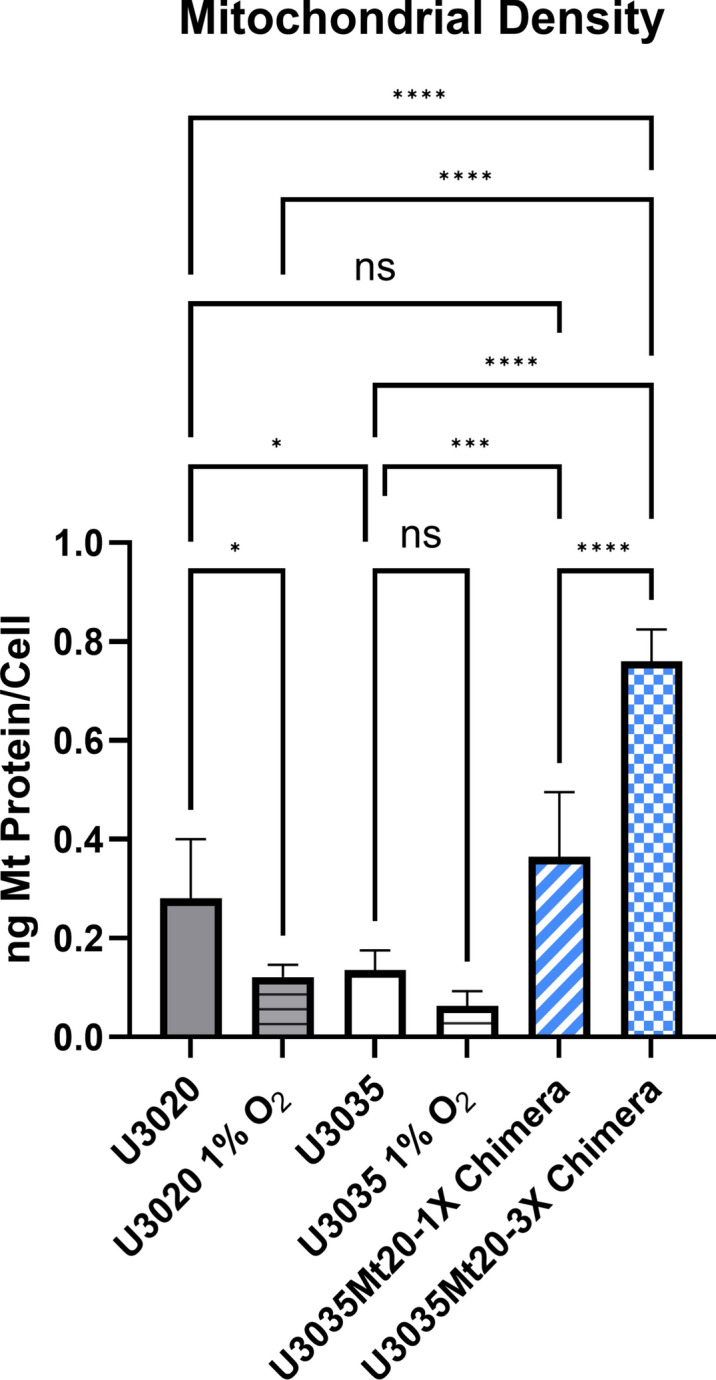
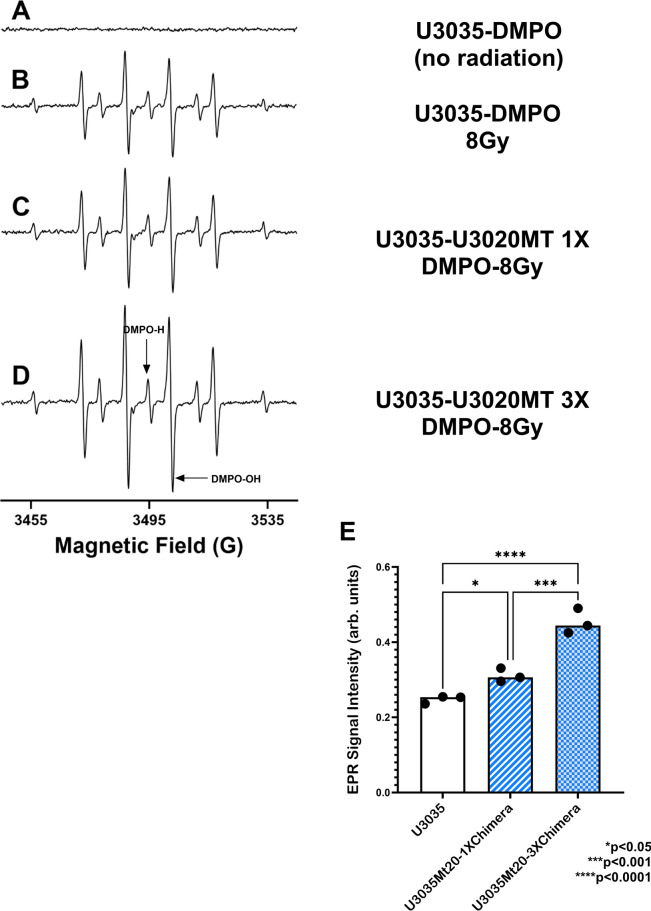
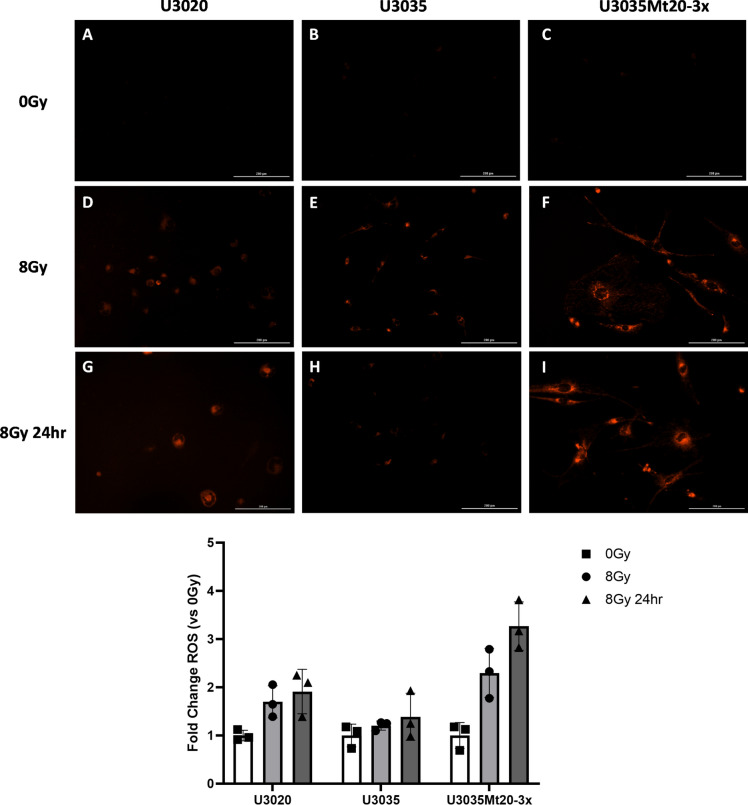
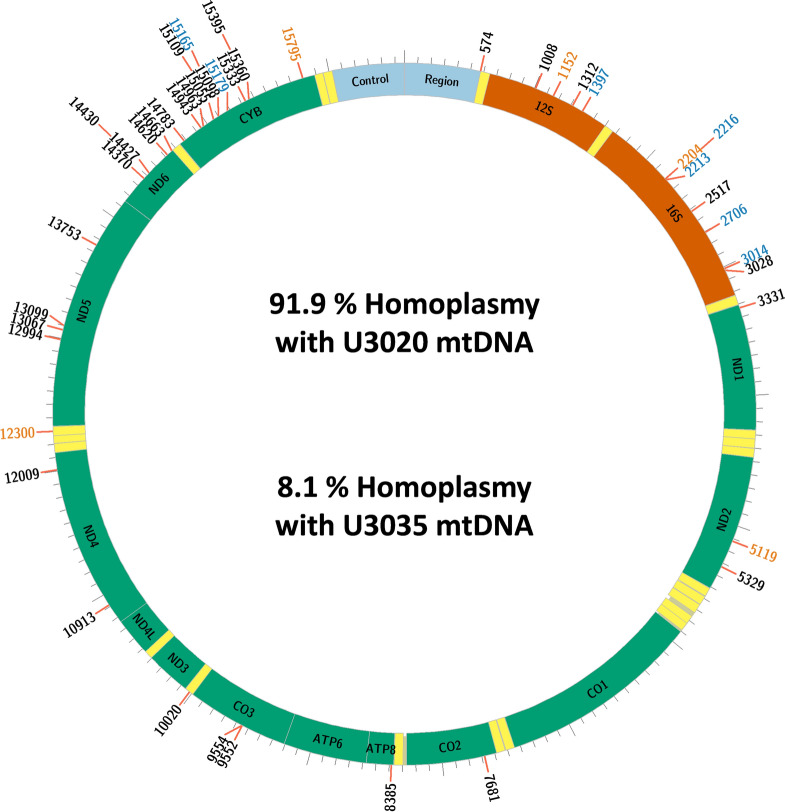
Glioblastoma (GBM) is the most aggressive primary brain malignancy in adults, with high recurrence rates and resistance to standard therapies. This study explores mitochondrial transplantation as a novel method to enhance the radiobiological effect (RBE) of ionizing radiation (IR) by increasing mitochondrial density in GBM cells, potentially boosting reactive oxygen species (ROS) production and promoting radiation-induced cell death. Using cell-penetrating peptides (CPPs), mitochondria were transplanted into GBM cell lines U3035 and U3046. Transplanted mitochondria were successfully incorporated into recipient cells, increasing mitochondrial density significantly. Mitochondrial chimeric cells demonstrated enhanced ROS generation post-irradiation, as evidenced by increased electron paramagnetic resonance (EPR) signal intensity and fluorescent ROS assays. The transplanted mitochondria retained functionality and viability for up to 14 days, with mitochondrial DNA (mtDNA) sequencing confirming high transfection and retention rates. Notably, mitochondrial transplantation was feasible in radiation-resistant GBM cells, suggesting potential clinical applicability. These findings support mitochondrial transplantation as a promising strategy to overcome therapeutic resistance in GBM by amplifying ROS-mediated cytotoxicity, warranting further investigation into its efficacy and mechanisms in vivo.

Keywords: Cell-penetrating peptide; EPR; Glioblastoma; Mitochondria; RBE; ROS; Radiation.


Conflict of interest statement

Declarations. Competing interests: CPC has been funded by NIGMS P20GM121322, NIH U54GM104942. He has received unrelated speaking honoraria from Carl Zeiss Meditech AG. KLM, AM, VVK and MV declare no potential conflict of interest.

Figures

Fig. 1
Fig. 1
Use of cell-penetrating peptides (CPPs) to increase mitochondria fraction in human U3035 GBM cells. Representative images of native U3035 cells (B,C) were compared to U3035 cells receiving 100 µg of isolated and MITO Green labelled mitochondria (1X; D,E) and 300 µg of isolated and MITO Green labelled mitochondria (3X; F,G). 10X magnification with 200 µm scale bar shown. ANOVA of mean intensities per cell analyzed (native n = 67; 1X n = 79; 3X n = 57) demonstrated statistical significance in differences across all groups (p < 0.001). Western blotting for cytochrome C in native U3035 cells and 1X and 3X U3035 mitochondrial transplants confirmed the increase in the mitochondrial protein in the transplants relative to the native cells (H). Original blot is presented in Supplementary Fig. S1.
Fig. 2
Fig. 2
Proof of concept for allogenic mitochondrial transplantation in human GBM cell lines. Using donor mitochondria from multiple human GBM cells lines (U3020 and U3035; MITO Red), CPPs were used to transplant 100 µg of mitochondria into recipient cells (U3035 (AE) and U3046 (GK); MITO Green). Scatter plots of mean staining intensities of native vs. donor mitochondria are presented in panel (F) (U3035-U3020; n = 77) and panel (L) (U3046-3035; n = 139) with a 1.3-fold and threefold increase in donor vs recipient mitochondrial fluorescence intensity in the U3035-U3020 and U3046-U3035 chimera, respectively. All images were acquired at 60X with 100 µm scale bars noted.
Fig. 2
Fig. 2
Proof of concept for allogenic mitochondrial transplantation in human GBM cell lines. Using donor mitochondria from multiple human GBM cells lines (U3020 and U3035; MITO Red), CPPs were used to transplant 100 µg of mitochondria into recipient cells (U3035 (AE) and U3046 (GK); MITO Green). Scatter plots of mean staining intensities of native vs. donor mitochondria are presented in panel (F) (U3035-U3020; n = 77) and panel (L) (U3046-3035; n = 139) with a 1.3-fold and threefold increase in donor vs recipient mitochondrial fluorescence intensity in the U3035-U3020 and U3046-U3035 chimera, respectively. All images were acquired at 60X with 100 µm scale bars noted.
Fig. 3
Fig. 3
Quantification of mitochondrial density. Mitochondrial densities from each cell line were obtained by dividing the total mass of mitochondrial protein (ug) that were extracted from individual lines by the number of live cells following dissociation and mitochondrial isolation. To demonstrate the predictable dynamic nature of mitochondrial density, and intact mitochondrial signaling response in the U3020 and U3035 lines, mitochondrial densities were also included from cells cultured under hypoxic conditions. One-way ANOVA was conducted using a Tukey’s multiple comparisons pos-hoc test to determine significance in the difference of means between groups. All data were analyzed using * p < 0.05 and ** p < 0.01.
Fig. 4
Fig. 4
EPR spectra of DMPO adducts. (A) U3035 cells + DMPO (200 mM). (B) U3035 cells + DMPO (200 mM) radiated using 8 Gy X-ray. (C) U3035 cells transplanted with mitochondria (1X) + DMPO (200 mM) and radiated using 8 Gy X-ray. (D) U3035 cells transplanted with mitochondria (3X) + DMPO (200 mM) and radiated using 8 Gy X-ray. (E) Quantification of absolute EPR signal intensity among U3035, U3035Mt-1XChimera, and U3035mt-3XChimera (n = 3 each group; *p < 0.05; ***p < 0.001; ****p < 0.0001).
Fig. 5
Fig. 5
Fluorescent probe of ROS generation. Representative Images of: U3020, U3035, and U3035Mt20-3 × cells stained with CellROX™ Deep Red fluorescent ROS probe following 0 Gy X-ray irradiation (AC). U3020, U3035, and U3035Mt20-3X cells stained with CellROX™ Deep Red fluorescent ROS probe following 8 Gy X-ray irradiation and assayed 1 h following treatment (DF). U3020, U3035, and U3035Mt20-3X cells stained with CellROX™ Deep Red fluorescent ROS probe following 8 Gy X-ray irradiation and assayed 24 h following treatment (DF). (G) Quantification of these data represented by mean fold-change of relative fluorescent units vs 0 Gy as a control.
Fig. 6
Fig. 6
Mitochondrial DNA sequence analysis within U3035MT20-3 × chimeras following transplantation. A Circos plot designating the circular mitochondrial DNA of the U3035Mt20-X3 chimeras and the single nucleotide polymorphisms that were either shared variably with U3020 or U3035 mtDNA sequences (grey), completely converted to U3020 (blue), or not expressed in either the donor or recipient lines (orange). Allele frequencies were averaged for the grey SNP’s and combined with the blue SNPs and it was found that the DNA sequence in the 14-day post-transplant U3035Mt20-X3 chimeras was most similar to the donor U3020 line and had only retained a small proportion of the recipient mtDNA sequence.
Fig. 7
Fig. 7
Allogenic mitochondrial transplantation in radiation resistant GBM. Representative images of (A) Brightfield view (60X) of U3035 resistant to 12 Gy radiation (2 Gy × 6 fractions). (B) Native mitochondria in radiation resistant U3035 cells stained with 200 nM MitoTracker™ Green vital dye. (C) Transplanted mitochondria from U3020 cells stained with 200 nM MitoTracker™ Red vital dye. (D) Overlay image of the green and red fluorescent channels highlighting successful transfer. Images were obtained at post-transplant at 48 h at 60X magnification and using 469/525 nm; 586/647 nm filters. (E) Mean fluorescence image intensity was calculated for the native (MITO Green) and donor (MITO Red) channels for each cell (n = 141) and expressed on XY plot (F).

Update of

References

    1. Stupp, R. et al. Effect of tumor-treating fields plus maintenance temozolomide vs maintenance temozolomide alone on survival in patients with glioblastoma: A randomized clinical trial. JAMA318(23), 2306–2316 (2017). - PMC - PubMed
    1. Stupp, R. et al. Radiotherapy plus concomitant and adjuvant temozolomide for glioblastoma. N. Engl. J. Med.352(10), 987–996 (2005). - PubMed
    1. McBain, C. et al. Treatment options for progression or recurrence of glioblastoma: a network meta-analysis. Cochrane Database Syst. Rev.5(1), CD013579 (2021). - PMC - PubMed
    1. Goenka, A. et al. The many facets of therapy resistance and tumor recurrence in glioblastoma. Cells10(3) (2021). - PMC - PubMed
    1. Minniti, G. et al. Current status and recent advances in reirradiation of glioblastoma. Radiat. Oncol.16(1), 36 (2021). - PMC - PubMed

LinkOut - more resources