. 2025 Mar 4;15(1):7598.
doi: 10.1038/s41598-025-92164-9.

Enhanced hepatitis E virus infection of polarised hepatocytes in vitro

Affiliations

Enhanced hepatitis E virus infection of polarised hepatocytes in vitro

Hannah M Brown et al. Sci Rep. .

Abstract

Hepatitis E virus (HEV) is a leading cause of acute viral hepatitis worldwide, and the only zoonotic hepatitis virus. HEV genotype 3 (HEV3) is associated with a range of clinical presentations including chronic infection in immunocompromised individuals in developed nations as well as sporadic cases of autochthonous HEV3 in Europe. Current in vitro models support low levels of HEV infection, hampering our understanding of viral pathogenesis and development of therapeutics. We developed modified culture methods for two widely used hepatoma cell lines, PLC-PRF-5 and Huh-7.5, and evaluated HEV infection. Simple epithelial-like polarity and differentiation formed in PLC-PRF-5 cells, evidenced by localisation of tight junction proteins occludin and zona-occludin 1 to intercellular junctions, and increased albumin production. Complex hepatocyte-like polarity was observed in Huh-7.5 cells, with tight junction proteins localised to shared internal bile canaliculi-like structures and retention of the fluorescent molecule, 5(6)-Carboxyfluorescein diacetate. Cells were infected with genotype 3 HEV, and enhanced infection and replication of HEV was observed using RT-qPCR and immunofluorescent labelling of HEV ORF2 and dsRNA. We describe robust, accessible models for HEV infection in vitro. These models will allow studies to further our understanding of this emerging zoonotic pathogen and develop therapeutic interventions.

Keywords: Hepatitis virus; Hepeviridae; In vitro model; Polarity; Zoonoses.


Conflict of interest statement

Declarations. Competing interests: The authors declare no competing interests.

Figures
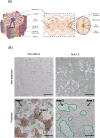
Fig. 1
Fig. 1
Polarised hepatoma cells develop distinct structure and morphology. (A) Schematic showing the arrangement of hepatocytes within a liver lobule, highlighting the location of distinct apical and basolateral membranes. (B) PLC-PRF-5 cells and Huh-7.5 cells were plated and polarised over 21 days and 10 days, respectively, and representative images of cellular morphology before and after polarisation were taken. Scale bar represents 100 μm. Cells displaying distinct morphologies within the same field of view are highlighted for PLC-PRF-5 (red) and Huh-7.5 (green) cells. Area 1 represents stratified cell layers, area 2 represents cell monolayers.
Fig. 2
Fig. 2
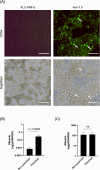
Hepatoma cells develop functional polarisation and differentiation. (A) Polarised PLC-PRF-5 and Huh-7.5 cultures were treated with CFDA for 30 min and bile canalicular like structures visualised (white arrows). Scale bar represents 100 μm. (B) Supernatant albumin content was quantified in non-polarised and polarised PLC-PRF-5 (B) and Huh-7.5 (C) cells. Data was normalised to cellular GAPDH and presented as mean ± standard deviation (SD) of triplicate samples.
Fig. 3
Fig. 3
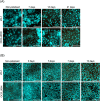
Polarised hepatoma cells express tight junction proteins. (A) PLC-PRF-5 cells and (B) Huh-7.5 cells were plated and polarised for 21 days and 10 days, respectively. Tight junction proteins zona-occludin 1 (ZO-1) and occludin were fluorescently labelled (orange) and visualised in non-polarised cells and over the course of polarisation. Sphere-like structures formed by Huh-7.5 cells are indicated by a white dotted circle in day 10 images. Scale bars represent 100 μm.
Fig. 4
Fig. 4
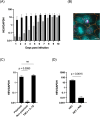
Polarised PLC-PRF-5 cells support enhanced HEV infection. (A) Polarised (black bars) and non-polarised (grey bars) PLC-PRF-5 cells were infected with HEV subtype 3c strain 14-16753 and HEV RNA in cell lysate was quantified by RT-qPCR and normalised to cellular GAPDH. Data presented as mean ± SD (n = 3 independent experiments). (B) Confocal images of HEV infected polarise PLC-PRF-5 cells show tight junction protein ZO-1 (orange) and HEV ORF2 (magenta. Scale bar represents 10 μm. (C) Polarised PLC-PRF-5 cells were infected in the presence or absence of 50ng/ml TNF-α and 50ng/ml IL-1β, non-polarised cells served as a control. At 4 days post infection HEV RNA in cell lysate was quantified by RT-qPCR and normalised to cellular GAPDH. Data presented as mean ± SD (n = 3). (D) To confirm the release of replication competent virions, supernatant from infected polarised PLC-PRF-5 cells at 6 days post infection was quantified (1.86 × 105 HEV RNA copies/µl) and used to inoculate polarised Huh-7.5 cells. Ribavirin (RIB) at 100µM was used to discern viral replication from residual inoculum. Intracellular HEV RNA was quantified, data normalised to cellular GAPDH and presented as mean ± SD of triplicate samples. p-values are indicated. ns = not significant.
Fig. 5
Fig. 5
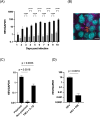
Huh-7.5 cells displaying complex polarity support enhanced HEV infection. (A) Polarised (black bars) and non-polarised (grey bars) Huh-7.5 cells were infected with HEV subtype 3c strain 14-16753, HEV RNA in cell lysate was quantified by RT-qPCR and normalised to cellular GAPDH. Data presented as mean ± SD (n = 3 independent experiments). (B) Confocal image of HEV infected polarised Huh-7.5 cells showing tight junction protein ZO-1 (orange) and HEV ORF2 (magenta). Scale bar represents 10 μm. (C) Polarised Huh-7.5 cells were infected in the presence or absence of 50ng/ml TNF-α and 50ng/ml IL-1β, non-polarised cells served as a control. At 4 days post infection HEV RNA in cell lysate was quantified by RT-qPCR and normalised to cellular GAPDH. Data presented as mean ± SD (n = 3). (D) To confirm the release of replication competent virions, supernatant from infected polarised Huh-7.5 cells at 6 days post infection was quantified (9.50 × 104 HEV RNA copies/µl) and used to inoculate polarised Huh-7.5 cells. Ribavirin (RIB) at 100µM was used to discern viral replication from residual inoculum. Intracellular HEV RNA was quantified, data normalised to cellular GAPDH and presented as mean ± SD of triplicate samples. p-values are indicated. Data presented for days 1 and 2 post infection were not significantly different.
Fig. 6
Fig. 6
Polarised hepatoma cells support a spreading HEV infection. Polarised and non-polarised (A) PLC-PRF-5 and (B) Huh-7.5 cells were infected with HEV subtype 3c strain 14-16753. Infected cells were fluorescently labelled for HEV ORF2 (magenta). Representative images of each timepoint were taken. HEV ORF2 positive cells in non-polarised (grey bars) and polarised (black bars) cultures were enumerated in (C) PLC-PRF-5 cells and (D) Huh-7.5 cells and are presented as the percent of total cells of 5 image counts. Error bars represent mean ± SD. p-values are indicated. ns = not significant.
Fig. 7
Fig. 7
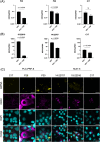
Diverse HEV clinical isolates infect polarised hepatoma cells. Polarised (A) PLC-PRF-5 cells and (B) Huh-7.5 cells were infected with HEV human clinical isolates P30 (3.39 × 103 HEV RNA copies/µl), P26 (9.22 × 103 HEV RNA copies/µl), C17 (9.55 × 103 HEV RNA copies/µl), 15-22016 (3.89 × 104 HEV RNA copies/µl) and 14-22707 (5.53 × 104 HEV RNA copies/µl). HEV RNA in cell lysate at day 6 was quantified by RT-qPCR. Ribavirin (RIB) at 100µM was used to differentiate viral replication from residual inoculum. Data was normalised to cellular GAPDH and presented as mean ± SD of triplicate samples. p-values are indicated. ns = not significant. (C) Representative confocal images of infected cells fluorescently labelled for HEV ORF2 (magenta) dsRNA (yellow) and DAPI (cyan) were taken, scale bar represents 20 μm.

References

    1. Izopet, J. et al. Hepatitis E virus infections in Europe. J. Clin. Virol.120, 20–26. 10.1016/j.jcv.2019.09.004 (2019). - PubMed
    1. WHO. Global Hepatitis Report. Report No. 978-92-4-156545-5 (Geneva, 2017).
    1. Aslan, A. T., Balaban, H. Y. & Hepatitis, E. virus: Epidemiology, diagnosis, clinical manifestations, and treatment. World J Gastroenterol 26, 5543–5560, (2020). 10.3748/wjg.v26.i37.5543 - PMC - PubMed
    1. Purdy, M. A. et al. ICTV virus taxonomy profile: hepeviridae 2022. J. Gen. Virol.10310.1099/jgv.0.001778 (2022). - PubMed
    1. EFSA, E. F. S. A. et al. Public health risks associated with hepatitis E virus (HEV) as a food-borne pathogen. EFSA J.15, e04886. 10.2903/j.efsa.2017.4886 (2017). - PMC - PubMed

LinkOut - more resources