Meta-Analysis
. 2025 Apr;57(4):815-828.
doi: 10.1038/s41588-024-02064-3. Epub 2025 Mar 4.

Genome-wide association study meta-analysis provides insights into the etiology of heart failure and its subtypes

Albert Henry  1   2 Xiaodong Mo  3 Chris Finan  1 Mark D Chaffin  4 Doug Speed  5 Hanane Issa  2 Spiros Denaxas  2   6   7   8 James S Ware  4   9   10   11   12 Sean L Zheng  9   11 Anders Malarstig  13   14 Jasmine Gratton  1 Isabelle Bond  1 Carolina Roselli  4   15 David Miller  16 Sandesh Chopade  1 A Floriaan Schmidt  1   17   18 Erik Abner  19 Lance Adams  20 Charlotte Andersson  21   22 Krishna G Aragam  4   23   24 Johan Ärnlöv  25   26 Geraldine Asselin  27 Anna Axelsson Raja  28 Joshua D Backman  29 Traci M Bartz  30 Kiran J Biddinger  4   23 Mary L Biggs  30   31 Heather L Bloom  32 Eric Boersma  33 Jeffrey Brandimarto  34 Michael R Brown  35 Søren Brunak  36 Mie Topholm Bruun  37 Leonard Buckbinder  14 Henning Bundgaard  28 David J Carey  38 Daniel I Chasman  39   40 Xing Chen  14 James P Cook  41 Tomasz Czuba  42 Simon de Denus  27   43 Abbas Dehghan  44 Graciela E Delgado  45 Alexander S Doney  46 Marcus Dörr  47   48 Joseph Dowsett  49 Samuel C Dudley  50 Gunnar Engström  51 Christian Erikstrup  52   53 Tõnu Esko  4   19 Eric H Farber-Eger  54 Stephan B Felix  47   48 Sarah Finer  55 Ian Ford  56 Mohsen Ghanbari  57 Sahar Ghasemi  48   58   59 Jonas Ghouse  60 Vilmantas Giedraitis  61 Franco Giulianini  39 John S Gottdiener  62 Stefan Gross  47   48 Daníel F Guðbjartsson  63   64 Hongsheng Gui  65 Rebecca Gutmann  66 Sara Hägg  67 Christopher M Haggerty  38 Åsa K Hedman  13 Anna Helgadottir  63 Harry Hemingway  2   6 Hans Hillege  15 Craig L Hyde  14 Bitten Aagaard Jensen  68 J Wouter Jukema  69   70 Isabella Kardys  33 Ravi Karra  71   72 Maryam Kavousi  57 Jorge R Kizer  73 Marcus E Kleber  45 Lars Køber  74 Andrea Koekemoer  75 Karoline Kuchenbaecker  76   77 Yi-Pin Lai  14 David Lanfear  65   78 Claudia Langenberg  79   80   81 Honghuang Lin  22   82 Lars Lind  83 Cecilia M Lindgren  4   84   85 Peter P Liu  86   87   88 Barry London  89 Brandon D Lowery  54 Jian'an Luan  81 Steven A Lubitz  4   90 Patrik Magnusson  67 Kenneth B Margulies  34 Nicholas A Marston  91 Hilary Martin  92 Winfried März  45   93   94 Olle Melander  95 Ify R Mordi  46 Michael P Morley  34 Andrew P Morris  41   85 Alanna C Morrison  35 Lori Morton  96 Michael W Nagle  14 Christopher P Nelson  75 Alexander Niessner  97 Teemu Niiranen  98   99 Raymond Noordam  100 Christoph Nowak  25 Michelle L O'Donoghue  91 Sisse Rye Ostrowski  49   101 Anjali T Owens  34 Colin N A Palmer  102 Guillaume Paré  103   104   105 Ole Birger Pedersen  101   106 Markus Perola  99 Marie Pigeyre  105   107 Bruce M Psaty  108   109 Kenneth M Rice  30 Paul M Ridker  39   40 Simon P R Romaine  75 Jerome I Rotter  110   111   112 Christian T Ruff  91 Marc S Sabatine  91 Neneh Sallah  2 Veikko Salomaa  99 Naveed Sattar  113 Alaa A Shalaby  114 Akshay Shekhar  96 Diane T Smelser  38 Nicholas L Smith  109   115   116 Erik Sørensen  49 Sundararajan Srinivasan  102 Kari Stefansson  63   117 Garðar Sveinbjörnsson  63 Per Svensson  118   119 Mari-Liis Tammesoo  19 Jean-Claude Tardif  27   120 Maris Teder-Laving  19 Alexander Teumer  48   59   121 Guðmundur Thorgeirsson  63   117   122 Unnur Thorsteinsdottir  63   117 Christian Torp-Pedersen  123 Vinicius Tragante  63 Stella Trompet  69   100 Andre G Uitterlinden  57   124 Henrik Ullum  125 Pim van der Harst  15   17 David van Heel  126 Jessica van Setten  17 Marion van Vugt  17 Abirami Veluchamy  46   102 Monique Verschuuren  127   128 Niek Verweij  15 Christoffer Rasmus Vissing  28 Uwe Völker  48   129 Adriaan A Voors  15 Lars Wallentin  130 Yunzhang Wang  67 Peter E Weeke  60 Kerri L Wiggins  31 L Keoki Williams  65 Yifan Yang  34 Bing Yu  35 Faiez Zannad  131 Chaoqun Zheng  28 Genes & Health Research TeamEstonian Biobank Research TeamDBDS Genomic ConsortiumFolkert W Asselbergs  2   8   18 Thomas P Cappola  34 Marie-Pierre Dubé  27   120 Michael E Dunn  96 Chim C Lang  46 Nilesh J Samani  75 Svati Shah  71   132   133 Ramachandran S Vasan #  22   134 J Gustav Smith #  42   135   136 Hilma Holm #  63 Sonia Shah #  3 Patrick T Ellinor #  4   90   137   138 Aroon D Hingorani #  1 Quinn Wells #  139 R Thomas Lumbers #  140   141   142 HERMES Consortium
Affiliations
Meta-Analysis

Genome-wide association study meta-analysis provides insights into the etiology of heart failure and its subtypes

Albert Henry et al. Nat Genet. 2025 Apr.

Abstract

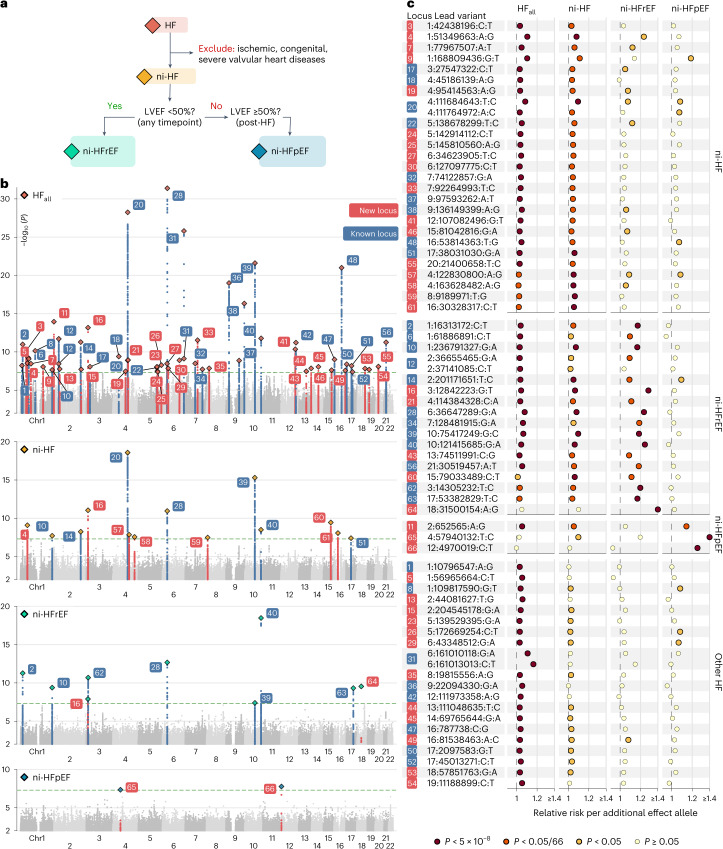
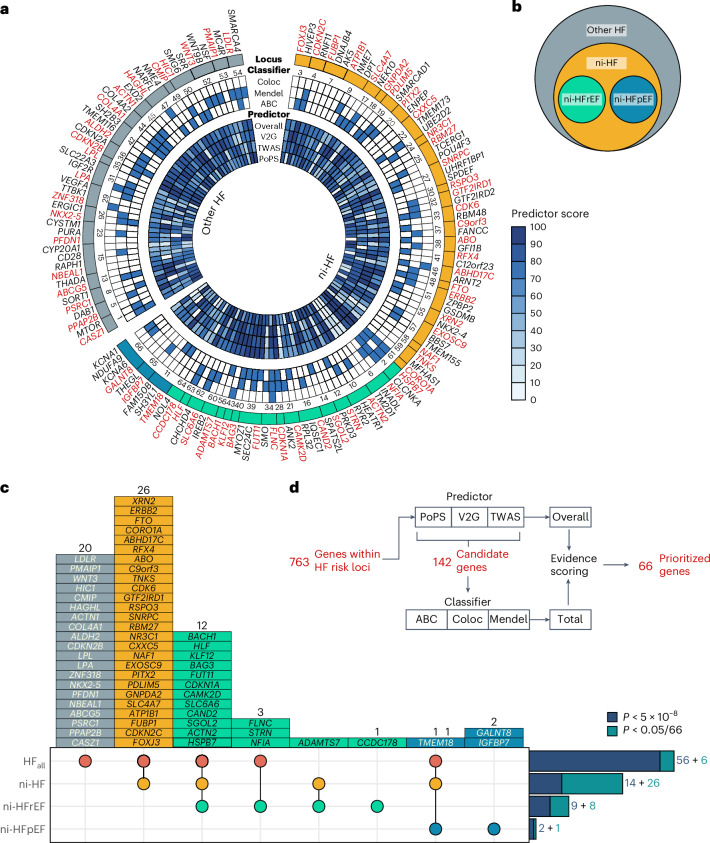
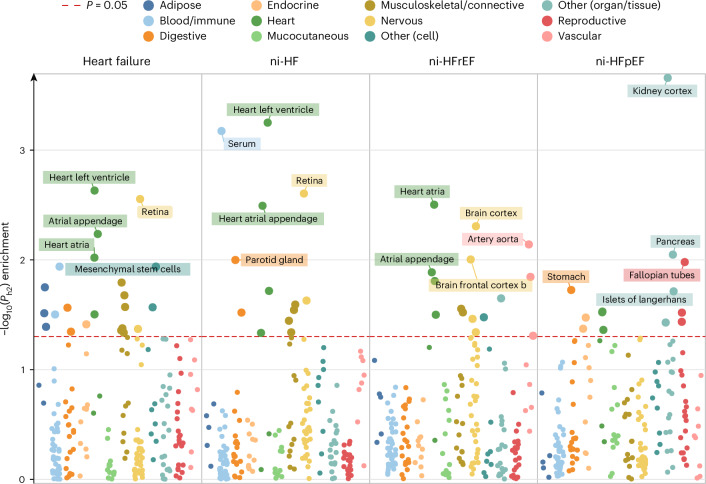
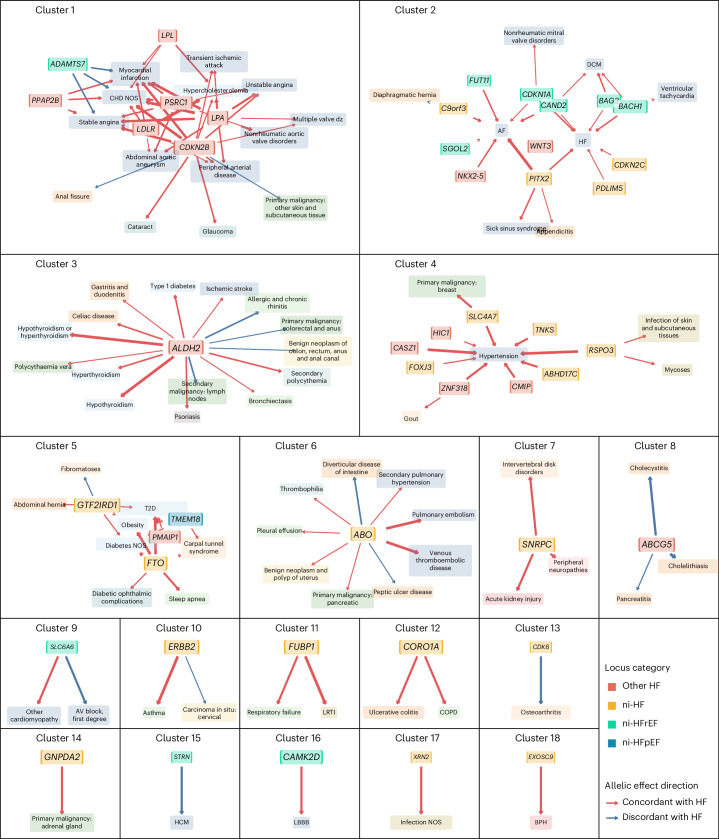
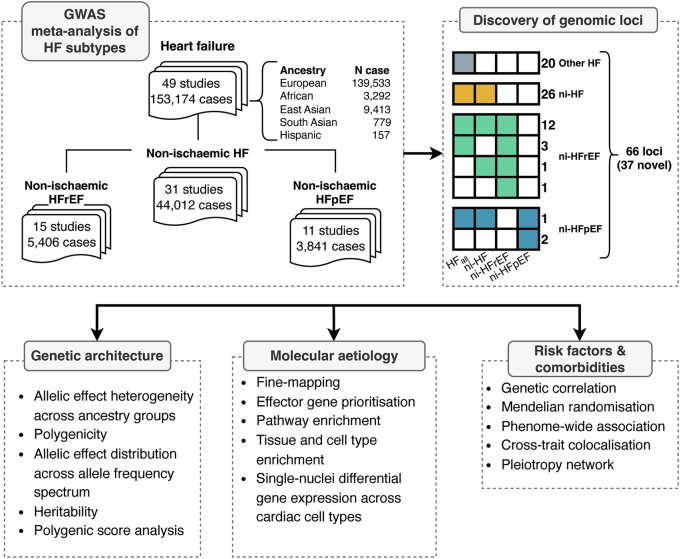
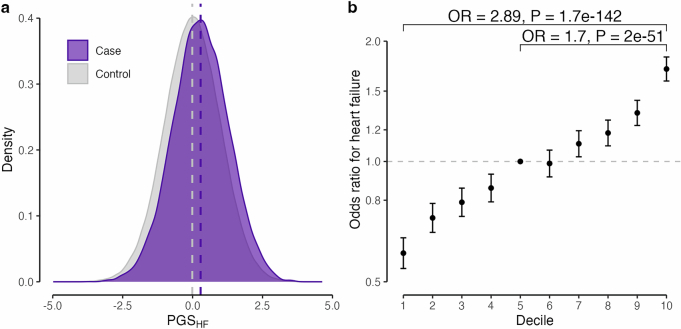
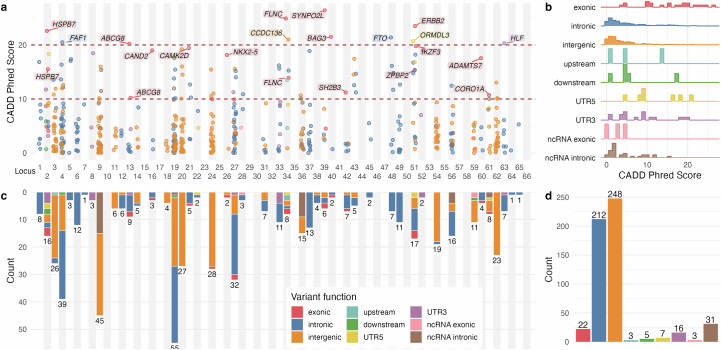
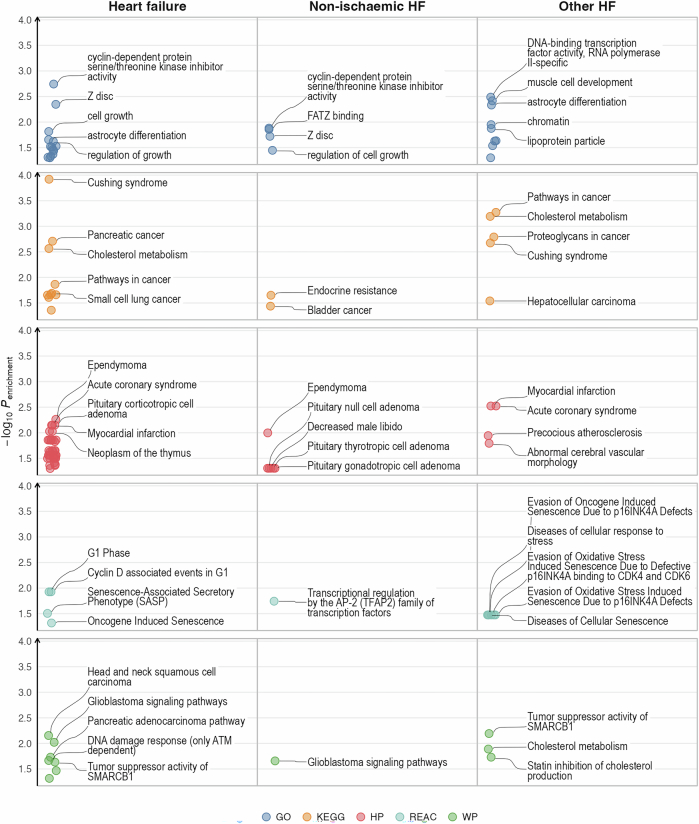
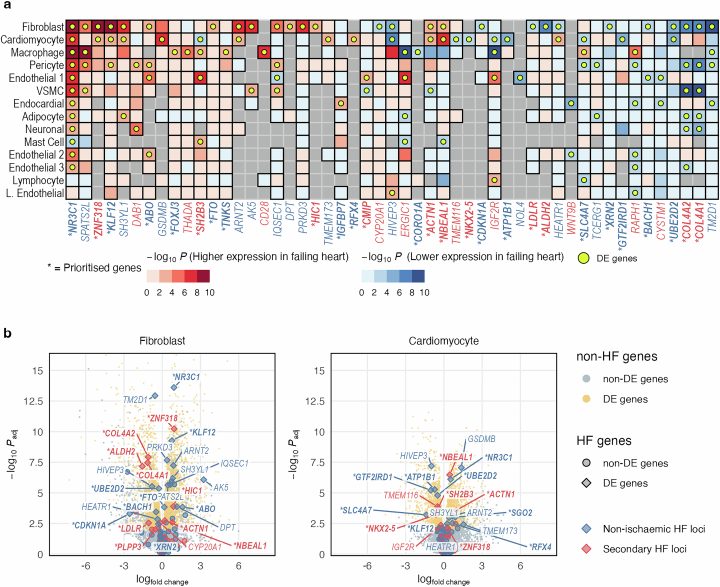
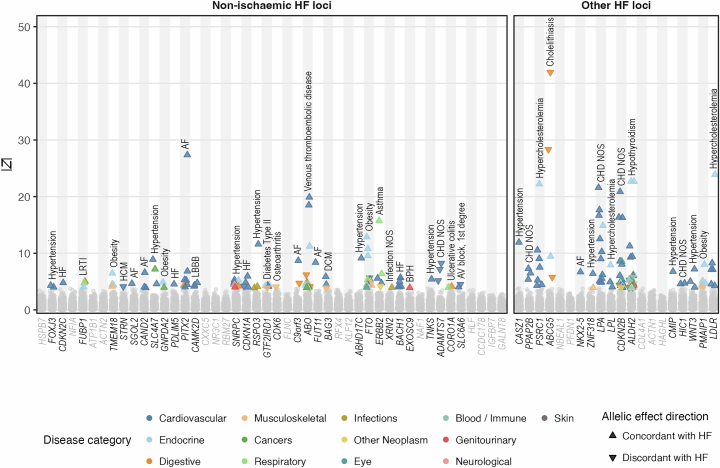
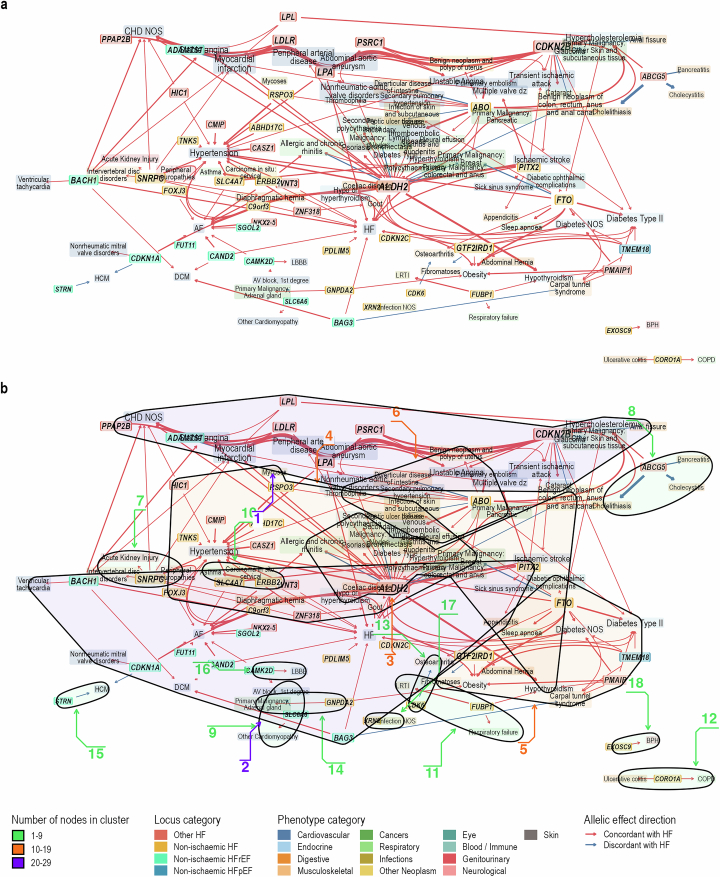
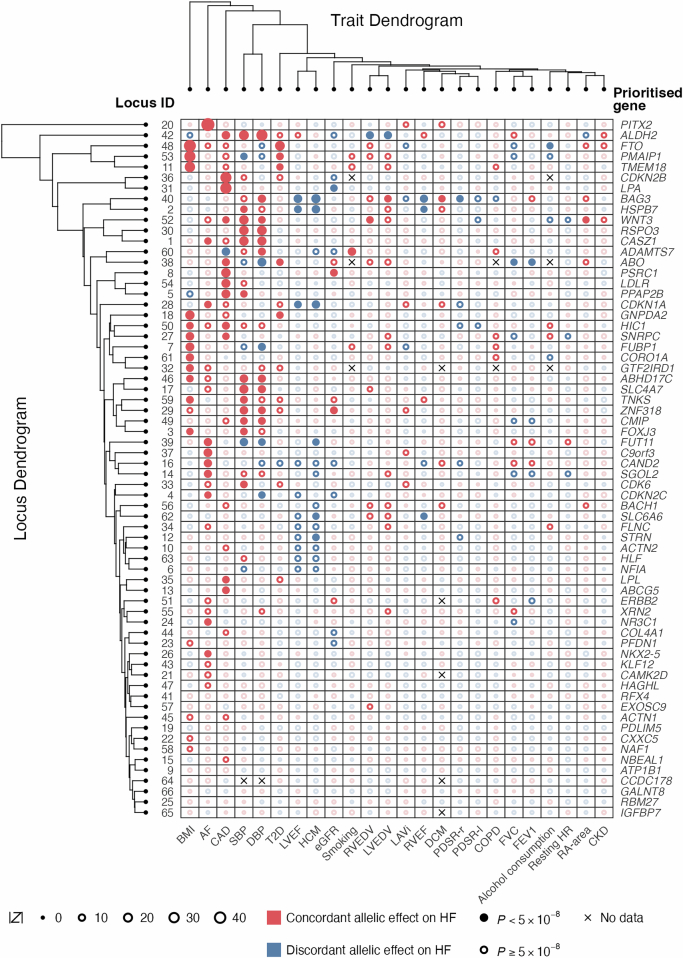
Heart failure (HF) is a major contributor to global morbidity and mortality. While distinct clinical subtypes, defined by etiology and left ventricular ejection fraction, are well recognized, their genetic determinants remain inadequately understood. In this study, we report a genome-wide association study of HF and its subtypes in a sample of 1.9 million individuals. A total of 153,174 individuals had HF, of whom 44,012 had a nonischemic etiology (ni-HF). A subset of patients with ni-HF were stratified based on left ventricular systolic function, where data were available, identifying 5,406 individuals with reduced ejection fraction and 3,841 with preserved ejection fraction. We identify 66 genetic loci associated with HF and its subtypes, 37 of which have not previously been reported. Using functionally informed gene prioritization methods, we predict effector genes for each identified locus, and map these to etiologic disease clusters through phenome-wide association analysis, network analysis and colocalization. Through heritability enrichment analysis, we highlight the role of extracardiac tissues in disease etiology. We then examine the differential associations of upstream risk factors with HF subtypes using Mendelian randomization. These findings extend our understanding of the mechanisms underlying HF etiology and may inform future approaches to prevention and treatment.


Conflict of interest statement

Competing interests: R.T.L. received institutional research support from Pfizer. R.T.L. has served as a paid consultant for Health Lumen and FITFILE. J.S.W. has acted as a consultant for MyoKardia, Pfizer, Foresite Labs and Health Lumen and received institutional support from Bristol Myers Squibb and Pfizer. S.d.D. was supported through grants from AstraZeneca and Roche Molecular Science/DalCor. J.R.K. declares stock ownership in AbbVie, Abbott, Bristol Myers Squibb, Johnson & Johnson, Medtronic, Merck and Pfizer. N.A.M. received speaking honoraria from Amgen and is involved in clinical trials with Ionis, Amgen, Pfizer and Novartis. B.M.P. serves on the Steering Committee of the Yale Open Data Access Project funded by Johnson & Johnson. C.T.R. received honoraria for scientific advisory boards and consulting from Anthos, Bayer, Bristol Myers Squibb, Daiichi Sankyo, Janssen and Pfizer and received institutional research grants from Anthos, AstraZeneca, Daiichi Sankyo, Janssen and Novartis. M.S.S. received substantial research grant support from Abbott Laboratories, Amgen, AstraZeneca, Bayer, Critical Diagnostics, Daiichi Sankyo, Eisai, Genzyme, Gilead, GlaxoSmithKline, Intarcia, Janssen Research and Development, The Medicines Company, MedImmune, Merck, Novartis, Poxel, Pfizer, Quark Pharmaceuticals, Roche Diagnostics and Takeda and has received consulting fees from Alnylam, AstraZeneca, Bristol Myers Squibb, CVS and Amgen. A.A.V. received consultancy fees and/or research support from AnaCardia, AstraZeneca, Bayer, BMS, Boehringer Ingelheim, Corteria, Cytokinetics, Eli Lilly, Moderna, Novartis, Novo Nordisk and Roche Diagnostics. M.-P.D. declares holding equity in Dalcor Pharmaceuticals, unrelated to this work. Members of the TIMI Study Group (ENGAGE, FOURIER, PEGASUS, SAVOR and SOLID) have received institutional research grant support through Brigham and Women’s Hospital from Abbott, Amgen, Anthos Therapeutics, ARCA Biopharma, AstraZeneca, Bayer HealthCare Pharmaceuticals, Daiichi Sankyo, Eisai, Intarcia, Ionis Pharmaceuticals, Janssen Research and Development, MedImmune, Merck, Novartis, Pfizer, Quark Pharmaceuticals, Regeneron Pharmaceuticals, Roche, Siemens Healthcare Diagnostics, Softcell Medical Limited, The Medicines Company, Zora Biosciences, Caremark, Dyrnamix, Esperon, IFM Pharmaceuticals and MyoKardia. The authors who are affiliated with deCODE genetics/Amgen and the authors affiliated with Pfizer declare competing financial interests as employees. The remaining authors declare no competing interests.

Figures

Fig. 1
Fig. 1. GWAS meta-analysis results across heart failure phenotypes.
a, Phenotyping schema. b, Manhattan plots of four HF subtypes showing −log10(P) for genetic associations from GWAS meta-analysis (y axis) across genetic variants ordered by chromosome and base pair positions (x axis). c, Summary of conditionally independent lead variants effect across HF phenotypes. Lead variants are denoted using chromosome, base pair position according to the GRCh37 assembly, risk-increasing allele in HF phenotype with the lowest P value for association and the other allele. Loci are categorized by the strength of genetic associations across HF phenotypes, with labels on the right edge of the plot. The presented P values are derived from two-sided association tests as described in Methods. Chr1, chromosome 1.
Fig. 2
Fig. 2. Prioritization of effector genes across heart failure genetic susceptibility loci.
a, Circular heatmap showing predictor score and Boolean classifier scores for 142 candidate genes across HF susceptibility loci. Blue tiles indicate a 'true' value and prioritized genes within each locus are highlighted in red. Coloc refers to colocalization evidence due to shared causal variants with gene expression level in the most relevant tissue; Mendel indicates overlap with Mendelian disease genes; ABC refers to the ABC measure for enhancer-gene activity of overlapping lead variants and their proxies or fine-mapped variants; overall refers to the weighted average of PoPS, TWAS statistics and V2G scaled predictor score (with 2:1:2 weight ratio). b, Schematic diagram of locus categorization by genetic associations across HF subtypes. c, Upset plot showing number of loci per phenotype category. d, Schematic diagram of effector gene prioritization.
Fig. 3
Fig. 3. Heritability enrichment of tissues and cell types across heart failure phenotypes.
Estimates for heritability enrichment of 206 tissues and cell types in 12 system/organ categories across four HF phenotypes are presented. Top five tissues/cell types per phenotype are highlighted with labels. The presented −log10(P) is derived from a one-sided statistical test of heritability enrichment using LDSC-SEG as described in Methods.
Fig. 4
Fig. 4. Etiologic clusters of heart failure identified through pleiotropy network analysis.
The network is constructed from 207 genotype–phenotype associations across 79 unique diseases and 46 HF susceptibility loci identified from phenome-wide association (PheWAS) analysis in UKB at FDR <1%. Nodes represent genetic loci labeled by the prioritized gene (solid background with bold–italic label, colored by categorical association across HF phenotypes) and phenotypes (translucent background, colored by phenotype category), sized proportionally to centrality measure. Edges (arrows connecting locus nodes to phenotype nodes) represent the association, with thickness representing the strength of association measured by absolute z score. The full pleiotropy network and phenotype category color codes are presented in Extended Data Fig. 9. Phenotype abbreviations, phenotype categories and phenome-wide association results are presented in Supplementary Table 15 and Extended Data Fig. 8. Cluster membership and centrality measures of nodes are presented in Supplementary Table 26 and Supplementary Fig. 13. CHD, coronary heart disease; NOS, not-otherwise-specified (nonspecific cause), AF, atrial fibrillation; AV block, atrioventricular block; LRTI, lower respiratory tract infection; COPD, chronic obstructive pulmonary disease; LBBB, left bundle branch block; BPH, benign prostatic hyperplasia.
Fig. 5
Fig. 5. Genetic colocalization between the overall heart failure phenotype and related phenotypes.
a, Chord diagram showing connections between 22 (of 24 tested) related phenotypes across 42 (of 66) HF susceptibility loci with posterior probability of shared causal variants (PPcoloc H4) > 0.8. Each band connects a locus to a phenotype, representing the sharing of causal genetic variants (colocalization) between the tested phenotype and HF at the locus. b, Total number of colocalized phenotypes across HF susceptibility loci. c, Total number of HF susceptibility loci with genetic colocalization across tested phenotypes. DBP, diastolic blood pressure; FVC, forced vital capacity; FEV1, forced expiratory volume in 1 s; LVEDV, left ventricular end diastolic volume; PDSR-r, peak diastolic strain rate radial; PDSR-l, peak diastolic strain rate longitudinal; RVEF, right ventricular ejection fraction; RVEDV, right ventricular end diastolic volume; LAVi, left atrial volume index.
Fig. 6
Fig. 6. Genetic correlation (rg) and MR estimates across 24 traits and four heart failure phenotypes.
Asterisks (*) indicate binary traits. MR effect estimates are reported as OR (ORMR) per doubling prevalence for binary traits or per s.d. increase for quantitative traits. Estimates that were robust to multiple-testing adjustment at FDR <1% and sensitivity analyses were indicated by light blue shade (for rg < 0 and ORMR < 1) or light red shade (for rg > 0 and ORMR > 1). The heatmaps represent two-sided P values for associations from different MR models, color-coded with the direction of MR estimates and strength of associations. Diamonds and whiskers on the forest plots represent point estimates and 95% CIs for rg (left) and ORMR (right). Missing diamonds/point whiskers with arrows represent point estimates/95% CIs outside the scale. HR, heart rate; RA-area, right atrial area.
Extended Data Fig. 1
Extended Data Fig. 1. Study summary. Each panel describes key analyses that are undertaken in the study. The discovery of genomic loci panel describe four categories of genomic loci identified in this study based on patterns of associations across the four phenotypes, where nonwhite colour in the heat map represents significant genetic association at a multiple-testing-corrected threshold of two-sided P < 0.05 / 66.
GWAS, genome-wide association study; HF, heart failure; HFall, overall heart failure; ni-HF, non-ischemic heart failure; ni-HFrEF, non-ischemic heart failure with reduced ejection fraction; ni-HFpEF, non-ischemic heart failure with preserved ejection fraction.
Extended Data Fig. 2
Extended Data Fig. 2. Allelic architecture of genetic variants associated with the overall heart failure phenotype.
The presented data points are conditionally independent variants that passed two-sided P < 5 × 10−8 (red colored points) and two-sided P less than equivalent type-I error rate (α) at a false discovery rate <1% as estimated using q value package in R (gray colored points). Green lines represent local polynomial regression with locally estimated scatterplot smoothing (LOESS), fitted separately for variants with risk ratio >1 and risk ratio <1 per additional minor allele. Green error bands represent the corresponding 95% confidence intervals of the regression lines.
Extended Data Fig. 3
Extended Data Fig. 3. SNP heritability across heart failure phenotypes.
The presented estimates represent SNP heritability on a liability scale (h2SNP-liability) estimated using 66-parameter BLD-LDAK and LDAK-thin heritability models using GWAS meta-analysis of European ancestry cohorts. The BLD-LDAK heritability estimate for non-ischemic HFpEF was unavailable due to limited sample size. Point estimates and confidence intervals for h2SNP-liability are represented by the bar height and error bars, with numerical estimates in percentage displayed on the top of the bars.
Extended Data Fig. 4
Extended Data Fig. 4. Association between polygenic score and risk of heart failure in UK Biobank.
a, Distribution of polygenic score for the overall heart failure phenotype (PGSHF) among 13,824 individuals with at least one documented event in linked electronic health record (case) and 332,843 individuals without any documented event (control) in UK Biobank. b, Odds ratios (OR) and 95% confidence intervals (represented as bullet points and error bars) for overall heart failure across deciles of PGSHF in UK Biobank with the fifth decile group as reference. Sample size and the numerical estimate for each decile are presented in Supplementary Table 8.
Extended Data Fig. 5
Extended Data Fig. 5. Functional consequences of fine-mapped genetic variants across genetic susceptibility loci for heart failure.
a, Predicted deleteriousness of 547 fine-mapped variants within 95% credible sets across 66 independent genomic loci for heart failure as measured by Combined Annotation-Dependent Depletion (CADD) Phred score. Nearest genes of fine-mapped variants with CADD Phred score >20 and fine-mapped exonic variants with CADD Phred score >10 are labeled. b, Histogram of CADD Phred score distribution among fine-mapped variants stratified by function. c,d, Locus-wide (c) and genome-wide (d) counts of fine-mapped variants stratified by variant function.
Extended Data Fig. 6
Extended Data Fig. 6. Enriched pathways within the effector heart failure gene set.
The presented terms are derived from Gene Ontology (GO), Kyoto Encyclopedia of Genes and Genomes (KEGG), Human Phenotype Ontology (HP), Reactome (REAC) and Wiki Pathways (WP) at a Penrichment < 0.05. Up to top 5 enriched terms per source in each heart failure phenotype gene set are labeled. Penrichment is calculated from enrichment analysis of candidate and prioritized gene sets with one-sided Fisher’s test, adjusted for multiple testing by multiplying the original P values to the ratio of the approximate threshold given the number of genes in the set and the initial experiment-wide type-I error rate of 0.05 as described in Methods. For display, P values are presented in −log10 scale, and terms that are enriched in both candidate and prioritized gene sets are collapsed by presenting the median values.
Extended Data Fig. 7
Extended Data Fig. 7. Differential gene expression of candidate heart failure effector genes across cardiac cell types from failing and non-failing hearts.
a, Differential gene expression profile for 51 candidate heart failure GWAS genes that are differentially expressed (DE) in at least one cardiac cell type, defined as survived multiple-testing correction at adjusted P value < 0.01 and showed a concordant differential expression sign in both CellBender and Cell Ranger quantifications and had no background contamination as estimated in CellBender (Methods). Red/blue colors represent higher/lower expression in cells from failing heart (compared to non-failing heart); gray color represents undetectable expression; yellow dots represent differential expression as defined above. b, Volcano plots showing differential gene expression between cells (fibroblasts and cardiomyocytes) from failing and non-failing heart samples. Candidate and prioritized heart failure (HF) genes (the latter is prefixed with *) that are differentially expressed (DE) are highlighted. The presented P values are derived from two-sided statistical tests and adjusted for multiple testing using the Benjamini–Hochberg procedure.
Extended Data Fig. 8
Extended Data Fig. 8. Phenome-wide association of heart failure sentinel genetic variants.
Association estimates are presented in absolute z score (vertical axis) for 294 disease phenotypes and 66 sentinel genetic variants across heart failure (HF) susceptibility loci (horizontal axis). Estimates which survived multiple-testing correction at false discovery rate (FDR) < 1% are highlighted, with top associated phenotype (largest absolute z score) per locus labeled. Loci are labeled by the prioritized gene and grayed out if no FDR-passing association is identified. Phenotype abbreviations and the numerical estimates are presented in Supplementary Table 15.
Extended Data Fig. 9
Extended Data Fig. 9. Pleiotropy network and etiologic clusters of heart failure.
The network is constructed from 207 genotype–phenotype associations across 79 unique diseases and 46 heart failure susceptibility loci identified from phenome-wide association (PheWAS) analysis at false discovery rate <1%. Nodes represent genetic loci labeled by the prioritized gene (solid background with bold–italic label, colored by categorical association across heart failure phenotypes) and phenotypes (translucent background, colored by phenotype category), sized proportionally to centrality measure. Edges (arrows connecting locus nodes to phenotype nodes) represent association, with thickness representing strength of association measured by absolute z score. a, Full network constructed using Davidson–Harel layout with edge bundling. b, Annotated network showing 18 etiological clusters identified using walktrap community detection algorithm. Phenotype abbreviations, phenotype categories and phenome-wide association results are presented in Supplementary Table 15 and Extended Data Fig. 8. Individual etiological clusters are presented in Fig. 4. Cluster membership and centrality measures of nodes are presented in Supplementary Table 26 and Supplementary Fig. 13.
Extended Data Fig. 10
Extended Data Fig. 10. Associations between heart failure sentinel genetic variants and related traits.
Circle data points represent association estimates in absolute Z score between 66 sentinel genetic variants within heart failure susceptibility loci (rows) and 24 related traits (columns). Non-transparent circles represent associations passing false discovery rate <1%. Solid circles with full color represent associations at P < 5 × 10−8, tested using two-sided statistical tests for association in the corresponding GWAS. Loci and traits were arranged based on hierarchical agglomerative clustering results, represented by dendrograms on the edges of the plot. Trait description and source for GWAS summary statistics are provided in Supplementary Table 27.

Similar articles

Cited by

References

    1. Shah, S. et al. Genome-wide association and Mendelian randomisation analysis provide insights into the pathogenesis of heart failure. Nat. Commun.11, 163 (2020). - PMC - PubMed
    1. Levin, M. G. et al. Genome-wide association and multi-trait analyses characterize the common genetic architecture of heart failure. Nat. Commun.13, 6914 (2022). - PMC - PubMed
    1. Joseph, J. et al. Genetic architecture of heart failure with preserved versus reduced ejection fraction. Nat. Commun.13, 7753 (2022). - PMC - PubMed
    1. Roger, V. L. Epidemiology of heart failure. Circ. Res.113, 646–659 (2013). - PMC - PubMed
    1. Seferović, P. M. et al. Heart failure in cardiomyopathies: a position paper from the Heart Failure Association of the European Society of Cardiology. Eur. J. Heart Fail.21, 553–576 (2019). - PubMed

Publication types