. 2025 Mar;57(3):616-625.
doi: 10.1038/s41588-025-02096-3. Epub 2025 Mar 4.

The contribution of genetic determinants of blood gene expression and splicing to molecular phenotypes and health outcomes

Affiliations

The contribution of genetic determinants of blood gene expression and splicing to molecular phenotypes and health outcomes

Alex Tokolyi et al. Nat Genet. 2025 Mar.

Abstract

The biological mechanisms through which most nonprotein-coding genetic variants affect disease risk are unknown. To investigate gene-regulatory mechanisms, we mapped blood gene expression and splicing quantitative trait loci (QTLs) through bulk RNA sequencing in 4,732 participants and integrated protein, metabolite and lipid data from the same individuals. We identified cis-QTLs for the expression of 17,233 genes and 29,514 splicing events (in 6,853 genes). Colocalization analyses revealed 3,430 proteomic and metabolomic traits with a shared association signal with either gene expression or splicing. We quantified the relative contribution of the genetic effects at loci with shared etiology, observing 222 molecular phenotypes significantly mediated by gene expression or splicing. We uncovered gene-regulatory mechanisms at disease loci with therapeutic implications, such as WARS1 in hypertension, IL7R in dermatitis and IFNAR2 in COVID-19. Our study provides an open-access resource on the shared genetic etiology across transcriptional phenotypes, molecular traits and health outcomes in humans ( https://IntervalRNA.org.uk ).


Conflict of interest statement

Competing interests: M.A.Q. is on the Key Opinion Leader panel for New England Biolabs. B.B.S. and H.R. are employees and stockholders of Biogen. C.D.W. is an employee and stockholder of Johnson & Johnson. S.P. and D.S.P. are employees and stockholders of AstraZeneca. D.J.G. is an employee and stockholder of BioMarin Pharmaceutical. D.J.R. is an employee of NHSBT. J.E.P. has received hospitality and travel expenses to speak at Olink-sponsored academic meetings (none within the past 5 years). A.S.B. has received grants outside of this work from AstraZeneca, Bayer, Biogen, BioMarin and Sanofi. M.I. is a trustee of the Public Health Genomics Foundation, a member of the Scientific Advisory Board of Open Targets and has a research collaboration with AstraZeneca that is unrelated to this study. The other authors declare no competing interests.

Figures

Fig. 1
Fig. 1. Overview of the multi-omic data available in the INTERVAL study and external cohorts, as well as the main analytical approaches.
The images depicting ‘genotypes’ (the figure is created with NIAID NIH Bioart) and ‘proteins’ (Protein Data Bank (PDB) code 2F6W) were reproduced from public databases. COVID-19 HGI, COVID-19 host genetics initiative; MAF, minor allele frequency.
Fig. 2
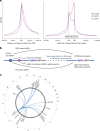
Fig. 2. Genetic influences on gene expression and splicing.
a, Distribution of lead variants at cis-eQTLs and cis-sQTLs around the TSS and gene body (normalized to the median gene length of 24 kb). b, Schematic representation of the trans-QTL mapping analysis approach and summary of the QTL discovery results. c, Circos plot of the trans-splicing of 18 sGenes by the cis-eQTL for QKI. TES, transcription end site.
Fig. 3
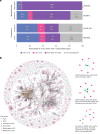
Fig. 3. Colocalization analyses of cis-eQTL and cis-sQTL with other molecular phenotypes.
a, Barplot of the percentage of omics traits with a colocalized association signal with a cis-eQTL or/and a cis-sQTL. b, Network graph of all pairwise colocalization results. Highlighted examples on the right-hand side include OAS1, IL6R and WARS1.
Fig. 4
Fig. 4. Mediation analyses of molecular phenotypes with transcriptional QTLs.
a, Schematic representation of the tested mediation model, for which eQTL and sQTL phenotypes mediate the relationship between genomic variants and levels of molecular phenotypes. The images depicting ‘independent genomic variants’ (the figure is created with NIAID NIH Bioart) and ‘molecular phenotypes’ (PDB code 2F6W) were reproduced from public databases. b, Total number of detected molecular phenotypes mediated by sQTLs and eQTLs. c, Colocalization of sQTLs excising the transmembrane domains of the interleukin receptors IL6R and IL17RA and mediation with plasma protein quantities (n = 3,024 for IL17RA and n = 3,072 for IL6R). The central point represents the mediation effect estimate. Error bars represent the upper and lower 95% confidence intervals of the estimated effects. d, Schematic representation of the splicing events excising transmembrane domains of the interleukin receptors IL6R and IL17RA.
Fig. 5
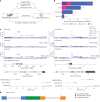
Fig. 5. Multitrait colocalization of cis-eQTLs and cis-sQTLs with molecular phenotypes and health outcomes.
a, Putative pathways and directions of the effect of sQTL signals for IL7R and WARS1 associated with plasma protein quantity, dermatitis and eczema, and hypertension, respectively. The image depicting ‘soluble protein’ was reproduced from a public database (PDB code 2F6W). b, Gene-level summary of colocalization of cis-eQTL and cis-sQTL with COVID-19 HGI summary statistics. The red dashed line represents genome-wide significance (P = 5 × 10−8) and the height toward the center represents the significance of the GWAS association. c, Example of a multitrait colocalization for COVID-19 in OAS1, with GWAS summary statistics, cis-pQTL, cis-eQTL and cis-sQTL.

References

    1. Loos, R. J. F. 15 years of genome-wide association studies and no signs of slowing down. Nat. Commun.11, 5900 (2020). - PMC - PubMed
    1. Albert, F. W. & Kruglyak, L. The role of regulatory variation in complex traits and disease. Nat. Rev. Genet.16, 197–212 (2015). - PubMed
    1. Neumeyer, S., Hemani, G. & Zeggini, E. Strengthening causal inference for complex disease using molecular quantitative trait loci. Trends Mol. Med.26, 232–241 (2020). - PubMed
    1. Suhre, K. et al. Human metabolic individuality in biomedical and pharmaceutical research. Nature477, 54–60 (2011). - PMC - PubMed
    1. Sun, B. B. et al. Genomic atlas of the human plasma proteome. Nature558, 73–79 (2018). - PMC - PubMed

LinkOut - more resources