

Using genotype imputation to integrate Canola populations for genome-wide association and genomic prediction of blackleg resistance
- PMID: 40038585
- PMCID: PMC11877698
- DOI: 10.1186/s12864-025-11250-4
Using genotype imputation to integrate Canola populations for genome-wide association and genomic prediction of blackleg resistance
Abstract
Background: Integrating germplasm populations genotyped by different genotyping platforms via genotype imputation is a way to utilize accumulated genetic resources. In this study, we used 278 canola samples genotyped via whole-genome sequencing (WGS) at 10× coverage to evaluate the imputation accuracy of three imputation approaches. The optimal imputation methods were used to impute and integrate two Canola genotype datasets: a diverse canola collection genotyped by genotyping-by-sequencing via transcriptome (GBS-t) and a double haploid (DH) line collection genotyped with low-coverage WGS (skim-WGS). The genomic predictive ability (GP) and detection power of marker‒trait association (GWAS) of the combined population for blackleg resistance were evaluated.
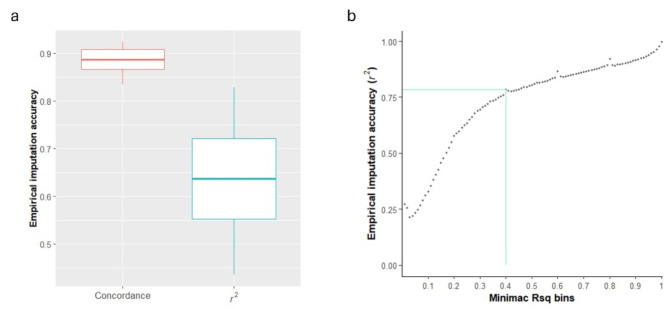
Results: The empirical imputation accuracy (r2) measured as the squared correlation between observed and imputed genotypes was moderate for Minimac3 when imputing from the GBS-t density to the WGS. The accuracy dramatically improved from 0.64 to 0.82 by removing SNPs with poor Minimac3-reported Rsq (Rsq < 0.2) quality statistics. The r2 for GLIMPSE was higher than that for Beagle when imputing from different low-coverage to full-coverage WGS. We imputed and integrated the diverse canola collection and the DH lines, and the combined population showed similar or slightly greater predictive ability (PA) for blackleg resistance traits than did each of the single populations with ~ 921 K SNPs. Higher marker-trait association (MTA) detection powers were indicated with the combined population; however, similar numbers of MTAs were discovered when each single population was combined in a meta-GWAS.
Conclusion: It is feasible to impute and integrate germplasms from different sequencing platforms for downstream analyses. However, genetic heterogeneity across populations could add complexity to the analysis. Increasing the sample size by combining datasets showed slightly greater predictive ability and greater detection power in GWASs in the present study.
Keywords: Blackleg resistance; Canola; GBS-t; GP; GWAS; Imputation; Whole-genome sequencing (WGS); skim-WGS.
© 2025. The Author(s).
Conflict of interest statement
Declarations. Ethics approval and consent to participate: Not applicable. Consent for publication: Not applicable. Competing interests: The authors declare no competing interests.
Figures


References
-
- Kim C, Guo H, Kong W, Chandnani R, Shuang L-S, Paterson AH. Application of genotyping by sequencing technology to a variety of crop breeding programs. Plant Sci. 2016;242:14–22. - PubMed
-
- Rasheed A, Hao Y, Xia X, Khan A, Xu Y, Varshney RK, He Z. Crop breeding chips and genotyping platforms: Progress, challenges, and perspectives. Mol Plant. 2017;10(8):1047–64. - PubMed
-
- Kumar P, Choudhary M, Jat BS, Kumar B, Singh V, Kumar V, Singla D, Rakshit S. Skim sequencing: an advanced NGS technology for crop improvement. J Genet 2021, 100. - PubMed
-
- Schmidt M, Kollers S, Maasberg-Prelle A, Großer J, Schinkel B, Tomerius A, Graner A, Korzun V. Prediction of malting quality traits in barley based on genome-wide marker data to assess the potential of genomic selection. Theor Appl Genet. 2016;129(2):203–13. - PubMed
MeSH terms
LinkOut - more resources
Full Text Sources
