. 2025 Mar 4;23(1):260.
doi: 10.1186/s12967-025-06296-7.

Transcriptomic profiling identifies ferroptosis and NF-κB signaling involved in α-dimorphecolic acid regulation of microglial inflammation

Affiliations

Transcriptomic profiling identifies ferroptosis and NF-κB signaling involved in α-dimorphecolic acid regulation of microglial inflammation

Xiao-Xi Zhu et al. J Transl Med. .

Abstract

Background: Microglia-evoked neuroinflammation contributes to neurodegenerative diseases such as multiple sclerosis (MS). Metabolic reprogramming, including changes in polyunsaturated fatty acids (PUFAs), plays a critical role in MS pathophysiology. Previous studies identified reduced plasma α-dimorphecolic acid (α-DIPA), a linoleic acid derivative, in MS patients. This study investigated the anti-inflammatory effects of α-DIPA on microglia and the underlying pathways.

Methods: Lipopolysaccharide (LPS)-induced BV-2 microglial inflammation was used as an in vitro model. α-DIPA effects were assessed via ELISA for nitric oxide (NO) release, flow cytometry was used to examine cell proliferation, activation and polarization, and transcriptomic analysis was applied to identify key signaling pathways regulated by α-DIPA.

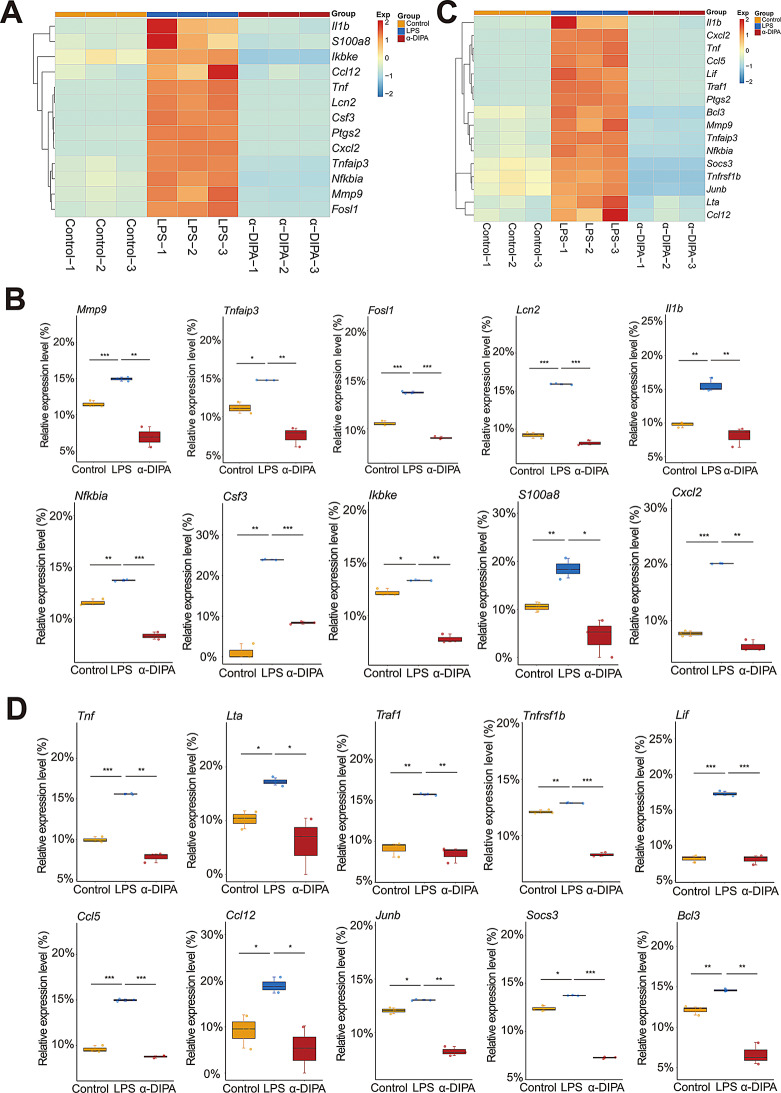
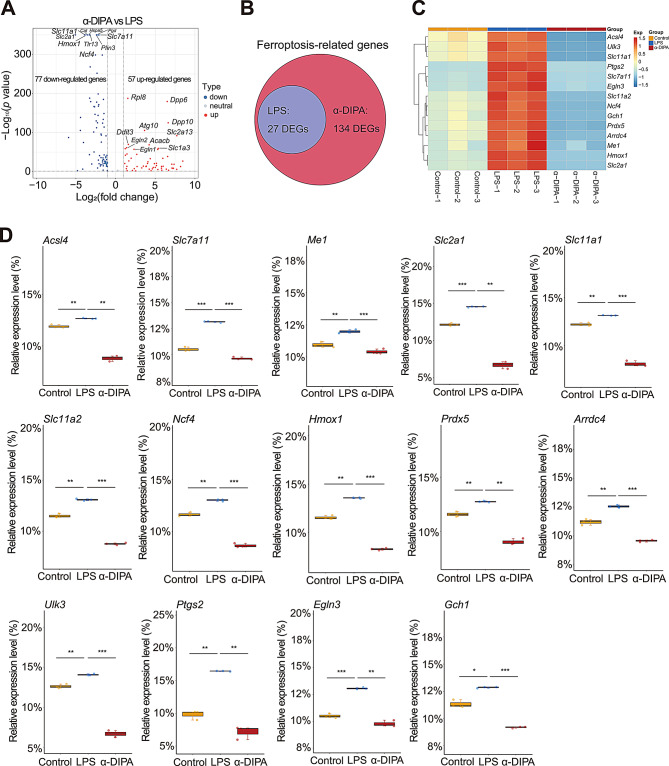
Results: ELISA results showed that exogenous α-DIPA treatment significantly inhibited LPS-induced NO release from BV-2 cells in a concentration-dependent manner. Moreover, flow cytometry analysis suggested that 40 µM α-DIPA treatment significantly repressed LPS-induced BV-2 cell proliferation, activation, as well as M1 and M2 type polarization. Furthermore, transcriptome analysis revealed that exogenous α-DIPA extensively and drastically decreased the transcriptional level of numerous genes that are involved in the regulation of inflammatory responses, for instance, proinflammatory genes such as Tnf and Ccl3 related to IL-17 and TNF-α signaling. In addition, we also observed that the expression of multiple genes in NF-κB signaling were also inhibited greatly by α-DIPA, such as Nfkb2 and Nfkbia. Notably, α-DIPA robustly suppressed LPS-induced mRNA expression of abundant genes participating in the ferroptosis pathway, including Acsl4, Slc7a11, Me1, and Hmox1. Interestingly, the expressions of multiple ferroptosis-related genes were regulated specifically by α-DIPA but not LPS, such as Acsl5, Acsl6, Alox5, Cars, Dpp3, Dpp10, Slc2a5, and Slc7a1.

Conclusion: α-DIPA inhibits microglial inflammation likely through regulating the pathways of the ferroptosis and NF-κB signaling. These results provided preliminary evidence for α-DIPA as a potential therapeutic candidate for neurodegenerative diseases like MS.

Keywords: Ferroptosis; Metabolomics; Microglial inflammation; Multiple sclerosis; NF-κB signaling; Transcriptomics; α-dimorphecolic acid.


Conflict of interest statement

Declarations. Ethical approval: The studies involving human participants were reviewed and approved by the Ethics Committee of Lishui Second People’s Hospital (approval number 20171116-3), and the Ethics Committee of Affiliated Hospital of Zunyi Medical University (approval number KLL-2022-305). All subjects provided their written informed consents to participate in this study and for future publication. Conflict of interest: The authors declare that the research was conducted in the absence of any commercial or financial relationships that could be construed as a potential conflict of interest.

Figures

Fig. 1
Fig. 1
Significant association between α-DIPA deficiency and MS. (A) The chemical structure formula of α-DIPA molecule (C18H32O3). (B) Relative level of α-DIPA was significantly decreased in plasma of MS-affected patients (MS) compared to healthy controls (Control). Samples were compared using unpaired two-tailed t-test. p value was corrected using BH method. ***: adjusted p < 0.001. (C) Receiver operating characteristic (ROC) curve analysis was used to evaluate the potency of α-DIPA in predicting MS. 22 patients with MS and 21 healthy controls were used for ROC analysis. Area under curve (AUC): 0.800, sensitivity: 86.40%, specificity: 71.40%, 95% of confidence interval (CI): 0.622–0.926. (D) Schematic diagram represents the workflow of this study and its relationship with our previous study. Liquid chromatography-mass spectrometry/mass spectrometry (LC-MS/MS)-based metabolomics analysis of 22 patients with MS and 21 matched healthy controls was carried out in our previous study [49]
Fig. 2
Fig. 2
α-DIPA inhibits LPS-induced microglia inflammation. (A) α-DIPA inhibits lipopolysaccharide (LPS)-induced microglial NO release in a concentration-dependent manner. BV-2 cells treated with 1.0 µg/mL LPS, and various concentrations (10, 20, 40, and 80 µM) of α-DIPA. BV-2 cells treated without LPS was used as negative control to detect baseline of NO release, while BV-2 cells treated with 100 µM L-NMMA, a total inhibitor of NO synthetase, was used as positive control. Five biological replicates for each group. (B-J) Treatment of 40 µM α-DIPA for 1 h significantly inhibited LPS-induced BV-2 cell proliferation (B), activation (C and D), as well as M1 type (E and F) and M2 type (G-J) polarization. CD68 marker was used for staining activated BV-2 cells (C and D). CCR7 marker was used for staining BV-2 cells with M1 type polarization (E and F). While double staining of CD206 and CD163 markers were used for detecting BV-2 cells with M2 type polarization (G-J). BV-2 cells were treated with 1.0 µg/mL LPS for 24 h in (B-J). MFI in (B), (D), (F), (H), and (J) denotes mean fluorescence intensity. Three biological replicates for each group in (B-J). Samples were compared using one-way ANOVA statistical analysis and Tukey’s multiple comparisons post-hoc test, *: p < 0.05, **: p < 0.01, ***: p < 0.001
Fig. 3
Fig. 3
Transcriptomic analysis reveals α-DIPA-regulated genes and their enriched signaling pathways. (A) PCA analysis showed samples in the three groups of control, LPS, and α-DIPA, separated from each other. Three biological replicates were used in each group. (B) Volcano plot showed 11,480 differential genes regulated by α-DIPA, including 8,388 up-regulated (such as Nrxn3) and 3,092 down-regulated genes (such as Tnf). Log2(FC) > 1.0 or Log2(FC) < -1.0, and p < 0.05 was used to identify up-regulated or down-regulated genes, respectively. (C) Bar plot represented the number of up-regulated and down-regulated differentially expressed genes (DEGs) regulated by LPS and α-DIPA, respectively. (D) and (E) Gene ontology (GO) and Kyoto Encyclopedia of Genes and Genomes (KEGG) pathway enrichment analysis result of 11,480 DEGs regulated by α-DIPA. BP: biological process; CC: cellular compartment; MF: molecular function. (F) Top30 of most significant genes involved in calcium signaling pathway. FPKM: Fragments Per Kilobase of exon model per Million mapped reads
Fig. 4
Fig. 4
α-DIPA inhibits LPS-induced proinflammatory genes expression and their participating pathways. (A) Venn analysis showed 778 overlapping genes shared by comparative groups of C1 (LPS versus control) and C2 (α-DIPA versus LPS), including 405 overlapping genes shared by up-regulated DEGs of C1 and down-regulated DEGs of C2, and 373 overlapping genes shared by down-regulated DEGs of C1 and up-regulated DEGs of C2. (B) KEGG pathway enrichment analysis showed the common 778 genes enriched in proinflammatory pathways, such as NF-κB, IL-17 and TNF signaling. (C) and (D) Heatmap represented α-DIPA inhibits the mRNA expression levels of LPS-induced genes involved in apoptosis (C) and necroptosis (D), which may attenuate inflammatory cascade induced by abundant proinflammatory factors released from cell death. (E) and (F) Heatmap and box plot showed α-DIPA treatment significantly suppress the transcriptional levels of LPS-induced genes involved in regulation of inflammatory responses, including Bcl6, Ccl3, Cd276, Ier3, Acod1, Fcgr2b, Nlrp3, Stap1, Casp4, and Zfp36. Three biological replicates for each group in (F). Samples were compared using Kruskal-Wallis test. Post-hoc analyses with Dunn’s correction were performed. *: p < 0.05, **: p < 0.01, ***: p < 0.001. Exp in (C-E) means expression. Red and blue represents up- and down-regulation, respectively
Fig. 5
Fig. 5
α-DIPA significantly repress expression levels of proinflammatory genes involved in IL-17 and TNF-α signaling. (A) and (B) Heatmap and box plot showed that the application of α-DIPA significantly decreased mRNA levels of LPS-induced genes involved in IL-17 signaling (A), including Mmp9, Tnfaip3, Fosl1, Lcn2, Il1b, Nfkbia, Csf3, Ikbke, S100a8, and Cxcl2 (B). (C) and (D) Heatmap and box plot showed that α-DIPA treatment significantly reduced expression levels of LPS-induced genes involved in TNF-α signaling (C), including Tnf, Lta, Traf1, Tnfrsf1b, Lif, Ccl5, Ccl12, Junb, Socs3, and Bcl3 (D). Three biological replicates for each group in (A-D). Samples were compared using Kruskal-Wallis test. Post-hoc analyses with Dunn’s correction were performed. *: p < 0.05, **: p < 0.01, ***: p < 0.001. Exp in (A) and (C) means expression. Red and blue represents up- and down-regulation, respectively
Fig. 6
Fig. 6
α-DIPA greatly reduces expression levels of proinflammatory genes in NF-κB signaling. (A) and (B) Heatmap and box plot represented that α-DIPA treatment largely decreased mRNA levels of LPS-induced genes involved in NF-κB signaling (A), including Nfkb2, Ccl4, Bcl2l1, Cd14, Cd40, Lat, Gadd45a, Relb, Syk, and Ticam1 (B). Three biological replicates for each group. Samples were compared using Kruskal-Wallis test. Post-hoc analyses with Dunn’s correction were performed. *: p < 0.05, **: p < 0.01, ***: p < 0.001. Exp in (A) denotes expression. Red and blue represents up- and down-regulation, respectively
Fig. 7
Fig. 7
α-DIPA robustly reduces the expression of ferroptotic genes. (A) Volcano plot showed that α-DIPA treatment significantly up-regulated and down-regulated the expression levels of 57 and 77 ferroptotic genes, respectively, such as Hmox1, Slc7a11, Dpp6, and Rpl8. Log2(FC) > 1.0 or Log2(FC) < -1.0, and p < 0.05 was used to identify up- or down-regulated genes, respectively. (B) Venn plot represented 134 ferroptosis-related genes regulated by α-DIPA, of which 27 genes were also regulated by LPS. (C) and (D) Heatmap and box plot showed that α-DIPA treatment significantly inhibited the expression levels of LPS-induced ferroptotic genes (C), including Acsl4, Me1, Slc7a11, Slc2a1, Slc11a1, Slc11a2, Ncf4, Hmox1, Prdx5, Arrdc4, Ulk3, Ptgs2, Egln3, and Gch1 (D), which potentially alleviate inflammatory reactions stimulated by ferroptosis and cell stress. Three biological replicates for each group in (A), (C), and (D). Samples were compared using Kruskal-Wallis test. Post-hoc analyses with Dunn’s correction were performed. *: p < 0.05, **: p < 0.01, ***: p < 0.001. Exp in (C) denotes expression. Red and blue represents up- and down-regulation, respectively
Fig. 8
Fig. 8
α-DIPA specifically regulates the expression level of ferroptosis-related genes. (A) and (B) Heatmap and box plot showed that α-DIPA but not LPS specifically increases the transcript levels of ferroptosis-related genes (A), including Acsl6, Alox5, Atg10, Dpp10, Slc1a2, Slc2a5, Slc2a12, Slc2a13, Slc7a13, and Slc7a14 (B). (C) and (D) Heatmap and box plot represented that α-DIPA but not LPS specifically decreases the transcript levels of ferroptosis-related genes (C), including Acsl5, Atg2b, Atg4b, Atg9a, Cars, Dpp3, Dpp9, Ncf1, Ncf2, Ncoa6, Ptgs1, Sirt2, Sirt4, Sirt7, Slc1a5, Slc2a8, Slc7a1, Tlr1, Tlr2, and Tlr6 (D). Three biological replicates for each group in (A-D). Samples were compared using Kruskal-Wallis test. Post-hoc analyses with Dunn’s correction were performed. *: p < 0.05, **: p < 0.01, ***: p < 0.001. NS: not significant. Exp in (A) and (C) means expression. Red and blue represents up- and down-regulation, respectively
Fig. 9
Fig. 9
Gene ontology and pathway enrichment analysis of α-DIPA-regulated ferroptotic genes. (A) and (B) Bar graph and scatter plot showed the gene ontology of biological process (A) and molecular function (B) analysis results of α-DIPA-regulated 134 ferroptosis genes, respectively. (C) Scatter plot showed KEGG pathway enrichment analysis result of 134 ferroptosis-related genes regulated by α-DIPA. (D) Protein-protein interaction (PPI) analysis showed that ferroptosis genes such as Hmox1 and Slc11a2 interacted with multiple genes like Cybb and Plin2 in α-DIPA-regulating networks. The online tool Search Tool for Recurring Instances of Neighbor (STRING) was used for PPI analysis
Fig. 10
Fig. 10
Schematic diagram of ferroptosis and NF-κB signaling involved in α-DIPA regulation of microglial inflammation and its potential role in MS pathology. Exogenous α-DIPA primarily suppresses microglial inflammation in vitro by regulating ferroptosis and NF-κB signaling, which inhibits cell proliferation, activation, M1 and M2 polarization, and NO release, thereby potentially impeding the onset and progression of MS driven by microglial inflammation. Moreover, α-DIPA may synergistically dampen microglial inflammatory responses by modulating calcium signaling and Toll-like receptor-mediated pathways

References

    1. Reich DS, Lucchinetti CF, Calabresi PA. Multiple Scler N Engl J Med. 2018;378(2):169–80. - PMC - PubMed
    1. Yong H, Chartier G, Quandt J. Modulating inflammation and neuroprotection in multiple sclerosis. J Neurosci Res. 2018;96(6):927–50. - PubMed
    1. Jakimovski D, et al. Multiple sclerosis. Lancet. 2024;403(10422):183–202. - PubMed
    1. Walton C, et al. Rising prevalence of multiple sclerosis worldwide: insights from the atlas of MS, third edition. Mult Scler. 2020;26(14):1816–21. - PMC - PubMed
    1. Browne P, et al. Atlas of multiple sclerosis 2013: A growing global problem with widespread inequity. Neurology. 2014;83(11):1022–4. - PMC - PubMed

LinkOut - more resources