. 2025 Mar 5;44(1):82.
doi: 10.1186/s13046-025-03337-3.

A blood-based liquid biopsy analyzing soluble immune checkpoints and cytokines identifies distinct neuroendocrine tumors

Affiliations

A blood-based liquid biopsy analyzing soluble immune checkpoints and cytokines identifies distinct neuroendocrine tumors

Pablo Mata-Martínez et al. J Exp Clin Cancer Res. .

Abstract

Background: Neuroendocrine neoplasms (NENs) comprise a group of rare tumors originating from neuroendocrine cells, which are present in both endocrine glands and scattered throughout the body. Due to their scarcity and absence of specific markers, diagnosing NENs remains a complex challenge. Therefore, new biomarkers are required, ideally, in easy-to-obtain blood samples.

Methods: A panel of blood soluble immune checkpoints (sPD-L1, sPD-L2, sPD-1, sCD25, sTIM3, sLAG3, Galectin-9, sCD27, sB7.2 and sSIGLEC5) and cytokines (IL4, IL6, IP10 and MCP1) was quantified in a cohort of 139 NENs, including 29 pituitary NENs, 46 pheochromocytomas and paragangliomas, and 67 gastroenteropancreatic and pulmonary (GEPP) NENs, as well as in 64 healthy volunteers (HVs). The potential of these circulating immunological parameters to distinguish NENs from HVs, differentiate among various NENs subtypes, and predict their prognosis was evaluated using mathematical regression models. These immunological factors-based models generated scores that were evaluated by Receiver Operating Characteristic (ROC) and Area Under the Curve (AUC) analyses. Correlations between these scores and clinical data were performed. From these analyses, a minimal signature emerged, comprising the five shared immunological factors across the models: sCD25, sPD-L2, sTIM3, sLAG3, and Galectin-9. This refined signature was evaluated, validated, and checked for specificity against non-neuroendocrine tumors, demonstrating its potential as a clinically relevant tool for identifying distinct NENs.

Results: Most of the immunological factors analyzed showed specific expression patterns among different NENs. Scores based on signatures of these factors identified NENs with high efficiency, showing AUCs ranging between 0.948 and 0.993 depending on the comparison, and accuracies between 92.52% and 95.74%. These scores illustrated biological features of NENs including the similarity between pheochromocytomas and paragangliomas, the divergence between gastrointestinal and pulmonary NENs, and correlated with clinical features. Furthermore, the models demonstrated strong performance in distinguishing metastatic and exitus GEPP NENs, achieving sensitivities and specificities ranging from 80.95% to 88.89%. Additionally, an easy-to-implement minimal signature successfully identified all analyzed NENs with AUC values exceeding 0.900, and accuracies between 84.11% and 93.12%, which was internally validated by a discovery and validation randomization strategy. These findings highlight the effectiveness of the models and minimal signature in accurately diagnosing and differentiating NENs.

Conclusions: The analysis of soluble immunological factors in blood presents a promising liquid biopsy approach for identifying NENs, delivering critical insights for both prognosis and diagnosis. This study serves as a proof-of-concept for an innovative clinical tool that holds the potential to transform the management of these rare malignancies, providing a non-invasive and effective method for early detection and disease monitoring.

Keywords: Immunological factor; Liquid biopsy; Neuroendocrine neoplasm; Soluble immune checkpoint.


Conflict of interest statement

Declarations. Ethics approval and consent to participate: This study involving human participants was reviewed and approved by local ethics committee of “La Paz University Hospital” with the reference number PI-5270. Consent for publication: Not applicable. Competing interests: The authors declare no competing interests.

Figures

Fig. 1
Fig. 1
Circulating levels of cytokines and soluble immune checkpoints in patients suffering from different neuroendocrine neoplasms. The concentration of the cytokines IL4, IL6, IP10, MCP1 and the soluble immune checkpoints sPD-L1, sPD-L2, sPD-1, sCD25, sTIM3, sLAG3, Galectin-9, sCD27, sB7.2 and sSIGLEC5 was analyzed in blood soluble fractions from healthy volunteers (HVs) and patients diagnosed with pheochromocytomas and paragangliomas (PPGLs), gastroenteropancreatic and pulmonary (GEPPs) neuroendocrine neoplasms (NENs) and pituitary NENs (Pit-NENs). Data are shown as violin plots showing quartiles. Comparisons between the four groups of individuals were performed by Kruskal–Wallis’ test. p-values are represented as *p < 0.05, ** p < 0.01, *** p < 0.001, **** p < 0.0001
Fig. 2
Fig. 2
Peripheral blood levels of cytokines and soluble immune checkpoints in patients suffering from pheochromocytomas or paragangliomas. The concentration of the cytokines IL4, IL6, IP10, MCP1 and the soluble immune checkpoints sPD-L1, sPD-L2, sPD-1, sCD25, sTIM3, sLAG3, Galectin-9, sCD27, sB7.2 and sSIGLEC5 was analyzed in blood soluble fractions from healthy volunteers (HVs) and patients diagnosed with pheochromocytomas or paragangliomas. Data are shown as violin plots showing quartiles. Comparisons between the four groups of individuals were performed by Kruskal–Wallis’ test or one-way ANOVA (for sPD-L2). p-values are represented as *p < 0.05, ** p < 0.01, *** p < 0.001, **** p < 0.0001
Fig. 3
Fig. 3
Circulating levels of cytokines and soluble immune checkpoints in patients suffering from gastroenteropancreatic and pulmonary neuroendocrine neoplasms. The concentration of the cytokines IL4, IL6, IP10, MCP1 and the soluble immune checkpoints sPD-L1, sPD-L2, sPD-1, sCD25, sTIM3, sLAG3, Galectin-9, sCD27, sB7.2 and sSIGLEC5 was analyzed in blood soluble fractions from healthy volunteers (HVs) and patients diagnosed with gastrointestinal, pancreatic or pulmonary neuroendocrine neoplasms. Data are shown as violin plots showing quartiles. Comparisons between the four groups of individuals were performed by Kruskal–Wallis’ test. p-values are represented as *p < 0.05, ** p < 0.01, *** p < 0.001, **** p < 0.0001
Fig. 4
Fig. 4
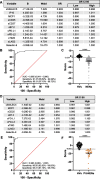
Regression models of circulating immunological factors identify neuroendocrine neoplasms. Wald backward stepwise regressions were performed, including IL4, IL6, IP10, MCP1, sPD-L1, sPD-L2, sPD-1, sCD25, sTIM3, sLAG3, Galectin-9, sCD27, sB7.2 and sSIGLEC5 as variables. A Optimal model differentiating neuroendocrine neoplasms (NENs) from healthy volunteers (HVs). B ROC curve analysis for identification of NENs. C Distribution of HVs and patients diagnosed with NENs according to the score generated as the optimal Youden index from the ROC curve in B. D Optimal model differentiating pituitary NENs (Pit-NENs) from healthy volunteers (HVs). E ROC curve analysis for identification of Pit-NENs. F Distribution of HVs and patients diagnosed with Pit-NENs according to the score generated as the optimal Youden index from the ROC curve in E. Area under the curves (AUC) are shown in B and E, as well as sensitivity and specificity. The 95% confidence intervals are shown in brackets. **** p < 0.0001, Mann–Whitney test
Fig. 5
Fig. 5
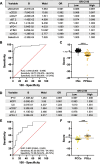
Regression models of circulating immunological factors identify pheochromocytomas and paragangliomas. Wald backward stepwise regressions were performed, including IL4, IL6, IP10, MCP1, sPD-L1, sPD-L2, sPD-1, sCD25, sTIM3, sLAG3, Galectin-9, sCD27, sB7.2 and sSIGLEC5 as variables. A Optimal model differentiating neuroendocrine pheochromocytomas and paragangliomas (PPGLs) from healthy volunteers (HVs). B ROC curve analysis for identification of PPGLs. C Distribution of HVs and patients diagnosed with PPGLs according to the score generated as the optimal Youden index from the ROC curve in B. D Optimal model differentiating pheochromocytomas (PCCs) and paragangliomas (PGLs). E ROC curve analysis for the differentiation between PCCs and PGLs. F Distribution of patients suffering from PCCs or PGLs according to the score generated as the optimal Youden index from the ROC curve in E. Area under the curves (AUC) are shown in B and E, as well as sensitivity and specificity. The 95% confidence intervals are shown in brackets. *** p < 0.001, **** p < 0.0001, Mann–Whitney test
Fig. 6
Fig. 6
Regression models of circulating immunological factors identify gastroenteropancreatic and pulmonary neuroendocrine neoplasms and their evolution. Wald backward stepwise regressions were performed, including IL4, IL6, IP10, MCP1, sPD-L1, sPD-L2, sPD-1, sCD25, sTIM3, sLAG3, Galectin-9, sCD27, sB7.2 and sSIGLEC5 as variables. A Optimal model differentiating gastrointestinal and pulmonary (GEPPs) NENs from healthy volunteers (HVs). B ROC curve analysis for identification of GEPPs. C Distribution of HVs and patients diagnosed with GEPPs according to the score generated as the optimal Youden index from the ROC curve in B. D Optimal model differentiating metastatic (Mets) and no metastatic (No mets) GEPP NENs. E ROC curve analysis for the differentiation between Mets and No mets GEPP NENs. F Distribution of patients suffering from Mets and No mets GEPP NENs according to the score generated as the optimal Youden index from the ROC curve in E. Red dots indicate patients with an exitus outcome. G Optimal model differentiating GEPP NENs according to their outcome (exitus or alive). H ROC curve analysis for the differentiation between patients suffering from GEPP NENs according to their outcome. I Distribution of patients evolved to exitus or alive according to the score generated as the optimal Youden index from the ROC curve in H. Area under the curves (AUC) are shown in B, E, and H, as well as sensitivity and specificity. The 95% confidence intervals are shown in brackets. C, F, **** p < 0.0001, Mann–Whitney test. I unpaired T test **** p < 0.0001
Fig. 7
Fig. 7
Regression models of circulating immunological factors shared among previous models identify different neuroendocrine neoplasms. Wald backward stepwise regressions, including as variables sCD25, sPD-L2, sTIM3, sLAG3 and Galectin-9, were performed. A ROC curve analysis for the differentiation between healthy volunteers (HVs) and patients suffering from neuroendocrine neoplasms (NENs). B Distribution of HVs and patients diagnosed with NENs according to the score generated as the optimal Youden index from the ROC curve in A. C ROC curve analysis for the differentiation between HVs and patients suffering from pituitary NENs (Pit-NENs). D Distribution of HVs and patients diagnosed with Pit-NENs according to the score generated as the optimal Youden index from the ROC curve in C. E ROC curve analysis for the differentiation between HVs and patients suffering from pheochromocytomas and paragangliomas (PPGLs). F Distribution of HVs and patients diagnosed with PPGLs according to the score generated as the optimal Youden index from the ROC curve in E. G ROC curve analysis for the differentiation between HVs and patients suffering from gastroenteropancreatic and pulmonary (GEPPs) NENs. H Distribution of HVs and patients diagnosed with GEPPs according to the score generated as the optimal Youden index from the ROC curve in G. In A, C, E, and G, the area under the curve (AUC), sensitivity and specificity are reported, with 95% confidence intervals shown in brackets. **** p < 0.0001, Mann–Whitney test
Fig. 8
Fig. 8
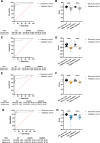
Validation of the minimal immunological signature by a discovery/validation randomization strategy. As indicated in the methods section, samples analyzed in Fig. 7 were randomly split at a 70:30 ratio in discovery and validation cohorts. Wald backward stepwise regressions were performed using samples from the discovery cohorts, including sCD25, sPD-L2, sTIM3, sLAG3, and Galectin-9 as variables. The resulting models were run on samples assigned to the validation cohorts in an unsupervised manner. A, C, E, and G: Comparisons of ROC curves built with either the discovery or validation cohorts, for the differentiation between healthy volunteers (HVs) and patients suffering from neuroendocrine neoplasms (NENs) (A), pituitary NENs (Pit-NENs) (C), pheochromocytomas and paragangliomas (PPGLs) (E), and gastroenteropancreatic and pulmonary (GEPPs) NENs (G). B, D, F, and H: Distribution of HVs and patients diagnosed with NENs (B), pituitary NENs (Pit-NENs) (D), pheochromocytomas and paragangliomas (PPGLs) (F), and gastroenteropancreatic and pulmonary (GEPPs) NENs (H) according to the scores generated as the optimal Youden index from each of their respective ROC curves. A, C, E, G Area under the curve (AUC) is shown for each of the cohorts, as well as sensitivity and specificity. 95% confidence intervals are shown in brackets. *** p < 0.001, **** p < 0.0001, Mann–Whitney test

References

    1. Gatta G, Capocaccia R, Botta L, Mallone S, De Angelis R, Ardanaz E, et al. Burden and centralised treatment in Europe of rare tumours: results of RARECAREnet—a population-based study. Lancet Oncol. 2017;18:1022–39. - PubMed
    1. Dasari A, Shen C, Halperin D, Zhao B, Zhou S, Xu Y, et al. Trends in the incidence, prevalence, and survival outcomes in patients with neuroendocrine tumors in the United States. JAMA Oncol. 2017;3:1335. Available from: http://oncology.jamanetwork.com/article.aspx?doi=10.1001/jamaoncol.2017..... - PMC - PubMed
    1. Ahmed M. Gastrointestinal neuroendocrine tumors in 2020. World J Gastrointest Oncol. 2020. p. 791–807. Available from: https://www.wjgnet.com/1948-5204/full/v12/i8/791.htm. - PMC - PubMed
    1. Gubbi S, Vijayvergia N, Yu JQ, Klubo-Gwiezdzinska J, Koch C. Immune checkpoint inhibitor therapy in neuroendocrine tumors. Horm Metab Res. 2022;54:795. Available from: https://www.thieme-connect.de/products/ejournals/abstract/10.1055/a-1908.... - DOI - PMC - PubMed
    1. Oronsky B, Ma PC, Morgensztern D, Carter CA. Nothing But NET: A Review of Neuroendocrine Tumors and Carcinomas. Neoplasia. 2017;19:991. Available from: https://www.sciencedirect.com/science/article/pii/S1476558617303470?via%.... - PMC - PubMed

LinkOut - more resources