. 2025 Dec;20(1):2471127.
doi: 10.1080/15592294.2025.2471127. Epub 2025 Mar 4.

Single and multi-omic characterization of a porcine model of ethanol-induced hepatic fibrosis

Affiliations

Single and multi-omic characterization of a porcine model of ethanol-induced hepatic fibrosis

Mark Hieromnimon et al. Epigenetics. 2025 Dec.

Abstract

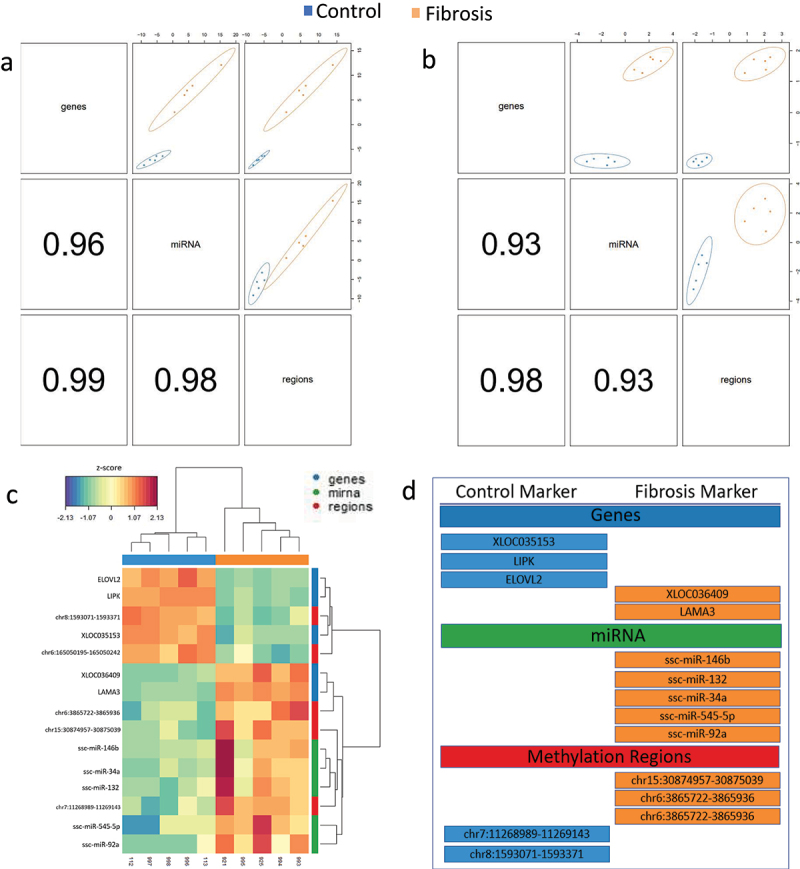
Cirrhosis is a form of end-stage liver disease characterized by extensive hepatic fibrosis and loss of liver parenchyma. It is most commonly the result of long-term alcohol abuse in the United States. Large animal models of cirrhosis, as well as of one of its common long-term sequelae, HCC, are needed to study novel and emerging therapeutic interventions. In the present study, liver fibrosis was induced in the Oncopig cancer model, a large animal HCC model, via intrahepatic, intra-arterial ethanol infusion. Liver sections from five fibrosis induced and five age-matched controls were harvested for RNA-seq (mRNA and lncRNA), small RNA-seq (miRNA), and reduced representation bisulfite sequencing (RRBS; DNA methylation). Single- and multi-omic analysis was performed to investigate the transcriptomic and epigenomic mechanisms associated with fibrosis deposition in this model. A total of 3,439 genes, 70 miRNAs, 452 lncRNAs, and 7,715 methylation regions were found to be differentially regulated through individual single-omic analysis. Pathway analysis indicated differentially expressed genes were associated with collagen synthesis and turnover, hepatic metabolic functions such as ethanol and lipid metabolism, and proliferative and anti-proliferative pathways including PI3K and BAX/BCL signaling pathways. Multi-omic latent variable analysis demonstrated significant concordance with the single-omic analysis. lncRNA's associated with UHRF1BP1L and S1PR1 genes were found to reliably discriminate the two arms of the study. These genes were previously implicated in human cancer development and vasculogenesis, respectively. These findings support the validity and translatability of this model as a useful preclinical tool in the study of alcoholic liver disease and its treatment.

Keywords: Alcoholic liver disease; epigenetics; fibrosis; pig cancer model; translational research.


Conflict of interest statement

Ron Gaba reports grants from United States National Institutes of Health, Guerbet USA LLC, Janssen Research & Development LLC, NeoTherma Oncology, TriSalus Life Sciences, and Sus Clinicals, Inc.; consulting fees from Boston Consulting Group; participation on Sus Clinicals, Inc. Scientific Advisory Board; participation on Fluidx Medical Technology Advisory board; participation on Kaveri University Advisory board; and stock or stock options in Sus Clinicals, Inc. Kyle Schachtschneider and Lawrence Schook report grants from United States National Institutes of Health, United States Department of Agriculture, Society of Interventional Radiology, Guerbet USA LLC, Janssen Research & Development LLC, TriSalus Life Sciences, and Earli Inc. Kyle Schachtschneider and Lawrence Schook are employed by and own equity in Sus Clinicals Inc. Ron Gaba, Lawrence Schook, and Kyle Schachtschneider have a pending patent for Modeling Oncology on Demand, United States Provisional Patent Application No. 62/813,307; Larry and Kyle have a pending patent for Patch for Targeted Delivery of an Oncogenic Cargo to a Tissue, United States Patent Application No. 63/306,449. Both pending patents are licensed to Sus Clinicals..

Figures

Figure 1.
Figure 1.
Impact of liver fibrosis induction on gene expression patterns. (a) Hierarchical clustering of subjects based on log fold change of all expressed genes. (b) Hierarchical clustering of subjects based on log change of differentially expressed genes (DEGs). (c) Two-dimensional principle component analysis of subjects based on log fold-change expression of all genes and (d) differentially expressed genes with 95% confidence ellipse. (e) Pathway analysis of differentially expression genes. Positive Z-score indicates predicted over-activation of a given pathway relative to control. Negative Z-score indicates under- activation of a pathway relative to control.
Figure 2.
Figure 2.
(a) Hierarchical clustering of subjects based on log fold change of differentially expressed long non-coding RNAs. (B) Classification of IncRNA orientation relative to its partner RNA. Adapted from Wucher et al., 2017 (30). (c) Pathway analysis of differentially expressed partner RNA’s to differentially expressed log non-coding RNA’s.
Figure 3.
Figure 3.
Impact of liver fibrosis induction on miRNA expression patterns. (a) Hierarchical clusting of subjects based on log fold expression of miRNA and (b) log fold expression of differentially expressed miRNA (DEmiRNA). (c) DEGs targeted by DE miRNAs in the Oncopig liver fibrosis model. nChord diagram of differentially expressed micro RNAs and target mRNA expression in the Oncopig liver fibrosis model. Copies per million (CPM) normalized DE miRNA expression versus FPKM normalized DEG expression for DE miRNSs with the greatest magnitude fold-change expression with associated Pearson coefficient.
Figure 4.
Figure 4.
Impact of liver fibrosis induction on DNA methylation patterns. (a) Hierarchical clustering of subjects based on methylation frequency within all identified methylation regions and (b) differentially methylated regions and genes. From outermost ring to innermost ring: coordinates of differentially methylated regions within each chromosome; density of hypomethylated regions along chromosome. (d) Pathway analysis of differentially expressed genes containing at least one differentially methylated region.
Figure 5.
Figure 5.
Correlation between methylation and repression in DEGs with 5; UTR DMRFs. (a) Methylation frequency versus fold-per-kilobase-million expression. (b) Methylation frequency versus fold-per-kilobase-million expression for each sample for each DEG within the top quartile of log fold-change expression.
Figure 6.
Figure 6.
Epigenetic alterations associated with fibrosis induction identified through multi-analysis. (a) 100 variable latent space and (b) # variable latest space component analysis (above the diagonal) and correlation coefficients (below the diagonal). (C) Hierarchical clustering of subjects and variable within the five-variable latent space. (d) Control and fibrosis markers within each ‘omics data set as predicted by the five-variable model. Fibrosis markers were defined as the mRNA’s, miRNA’s, and methylation regions which were either overexpressed or hypermethylated in Oncopig fibrotic livers whereas control markers were defined as the mRNA’s, miRNA’s, and methylation regions overexpressed or hypermethylated in the control arm of the study.

References

    1. Li S, Saviano A, Erstad DJ, et al. Clinical medicine risk factors, pathogenesis, and strategies for hepatocellular carcinoma prevention: emphasis on secondary prevention and its translational challenges. J Clin Med 2020;9(12): 3817. doi: 10.3390/jcm9123817 - DOI - PMC - PubMed
    1. Roerecke M, Vafaei A, Hasan OSM, et al. Alcohol consumption and risk of liver cirrhosis: a systematic review and meta-analysis. Am J Gastroenterol. 2019;114(10):1574–17. doi: 10.14309/AJG.0000000000000340 - DOI - PMC - PubMed
    1. Tarantino G, Zhang P, Wang W, et al. Similarities and differences: a comparative review of the molecular mechanisms and effectors of NAFLD and AFLD. Front Physiol. 2021;1:710285. doi: 10.3389/fphys.2021.710285 - DOI - PMC - PubMed
    1. Du D, Liu C, Qin M, et al. Metabolic dysregulation and emerging therapeutical targets for hepatocellular carcinoma. Acta Pharmaceutica Sin B. 2022;12(2):558–580. doi: 10.1016/j.apsb.2021.09.019 - DOI - PMC - PubMed
    1. Fan Y, Zhang R, Wang C, et al. STAT3 activation of SCAP-SREBP-1 signaling upregulates fatty acid synthesis to promote tumor growth. J Biol Chem. 2024;300(6):107351. doi: 10.1016/J.JBC.2024.107351 - DOI - PMC - PubMed