. 2025 Feb 18:16:1519128.
doi: 10.3389/fimmu.2025.1519128. eCollection 2025.

Recognition of MR1-antigen complexes by TCR Vγ9Vδ2

Affiliations

Recognition of MR1-antigen complexes by TCR Vγ9Vδ2

José Pedro Loureiro et al. Front Immunol. .

Abstract

The TCR-mediated activation of T cells expressing the TCR Vγ9Vδ2 relies on an innate-like mechanism involving the butyrophilin 3A1, 3A2 and 2A1 molecules and phospho-antigens, without the participation of classical antigen-presenting molecules. Whether TCR Vγ9Vδ2 cells also recognize complexes composed of antigens and antigen-presenting molecules in an adaptive-like manner is unknown. Here, we identify MR1-autoreactive cells expressing the TCR Vγ9Vδ2. This MR1-restricted response is antigen- and CDR3δ-dependent and butyrophilin-independent. TCR gene transfer reconstitutes MR1-antigen recognition, and engineered TCR Vγ9Vδ2 tetramers interact with soluble MR1-antigen complexes in an antigen-dependent manner. These cells are present in healthy individuals with low frequency and are mostly CD8+ or CD4-CD8 double negative. We also describe a patient with autoimmune symptoms and TCR γδ lymphocytosis in which ~10% of circulating T cells are MR1-self-reactive and express a TCR Vγ9Vδ2. These cells release pro-inflammatory cytokines, suggesting a possible participation in disease pathogenesis. Thus, MR1-self-antigen complexes can interact with some TCRs Vγ9Vδ2, promoting full cell activation and potentially contributing to diseases.

Keywords: MR1; TCR γδ; Vγ9Vδ2; adaptive immunity; antigen recognition.


Conflict of interest statement

The authors declare that the research was conducted in the absence of any commercial or financial relationships that could be constructed as a potential conflict of interest.

Figures
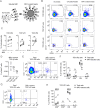
Figure 1
Figure 1
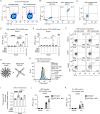
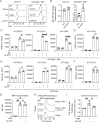
MR1-reactive TCR γδ cells are present in the peripheral blood of healthy donors. (A) Schematic representation of beads coated with a soluble form of MR1 secreted by A375 cells. MR1-coated beads were used to stimulate TCR γδ cells negatively enriched from PBMCs of healthy donors. (B) Activation of enriched TCR γδ cells freshly isolated from PBMCs upon challenge with MR1-coated or uncoated beads. Flow cytometry plots show the expression of CD69 (x-axis) and CD137 (y-axis) on TCR Vδ2-, Vδ1-, and Vδ3-expressing cells. Numbers indicate percentages of cells in the gated areas. Data is representative of one healthy donor among the five investigated. (C) Summary of activated TCR Vδ2-, Vδ1-, and Vδ3-expressing cells after stimulation with MR1-coated or uncoated beads. Each symbol represents a different donor. Two-tailed ratio paired t-test. p < 0.05; ns, not significant. (D) Summary of MR1-reactive TCR Vδ2-, Vδ1-, and Vδ3-expressing cells as a percentage of total T cells. Each symbol represents a different donor. Bars indicate the median values. (E, G) CD4 and CD8 expression on total (E) TCR Vδ2 cells or (G) TCR Vδ1 cells and on MR1-reactive (E) TCR Vδ2 cells or (G) TCR Vδ1 cells. Numbers indicate percentages of cells in the quadrants. Data is representative of one healthy donor among the five investigated. (F, H) Summary of CD4 and CD8 expression on total (F) TCR Vδ2 cells or (H) TCR Vδ1 cells and on MR1-reactive (F) TCR Vδ2 cells or (H) TCR Vδ1 cells. Each dot represents a different donor. DN, double negative; DP, double positive. Two-way ANOVA with repeated measures, Sidak’s multiple comparisons test. ns, not significant; p < 0.05; ∗∗∗ p < 0.001; ns, not significant.
Figure 2
Figure 2
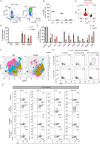
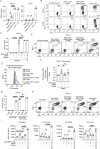
The TCR Vγ9Vδ2 cell clone D9A10 interacts with MR1 and is activated upon MR1 recognition. (A) Gating used to sort activated TCR Vδ2 cells from PBMCs upon challenge with MR1-coated or uncoated beads. Flow cytometry plots show the expression of TCR Vδ2 and CD137. Numbers indicate percentages of cells in the gated areas. (B) Staining with anti-Vγ9 and anti-Vδ2 mAbs on an irrelevant TCR αβ cell clone (left) and on the MR1-reactive cell clone D9A10 (right). Numbers indicate percentages of cells in the quadrants. (C) CD4 and CD8 phenotype of the T cell clone D9A10. (D, E) Activation of (D) D9A10 and (E) D15A3 cell clones using beads coated or not with soluble MR1 in the presence or absence of anti-MR1 or isotype-matched mAbs. Both clones were stimulated with A375 cells treated with Zol (10µM) as a positive control. Data is representative of three independent experiments. Bar plots of IFN-γ release mean ± SD of triplicate independent cultures. One-way ANOVA, Dunnett’s multiple comparisons test. ∗∗∗∗ p< 0.0001; ns, not significant. (F) Intracellular staining of IFN-γ and TNF-α in D9A10 clone after stimulation using beads coated or not with soluble MR1, in the presence or absence of anti-MR1 or isotype-matched mAbs. Numbers indicate percentages of cells in the quadrants. Data is representative of three independent experiments. (G) Schematic representation of the reagents used for staining MR1-coated beads with D9A10 TCR tetramers. (H) Staining of uncoated- or MR1-coated beads using D9A10 TCR tetramers in the presence or absence of anti-MR1 or isotype-matched mAbs. Histograms are representative of at least three independent experiments. Median fluorescence intensity (MFI) is indicated next to each histogram. (I) Summary of D9A10 TCR tetramer staining of MR1-coated or uncoated beads in the absence or presence of anti-MR1 or isotype-matched mAbs. TCR tetramer MFI was normalized to uncoated beads. Bar plot of mean ± SD of at least three independent experiments. Each dot represents an independent experiment. One-way ANOVA, Dunnet’s multiple comparisons test. ∗∗∗ p< 0.001; ∗∗∗∗ p< 0.0001; ns, not significant. (J, K) Activation of the TCR Vγ9Vδ2 clones (J) D9A10 and (K) D15A3 after stimulation with A375 β2m cells (filled bars) or A375 β2m MR1 cells (open bars) pulsed with Zol or vehicle. Bar plots of IFN-γ release mean ± SD of triplicate independent cultures of two independent experiments. Two-way ANOVA, Sidak’s multiple comparisons test. ∗∗∗∗ p < 0.0001; ns, not significant.
Figure 3
Figure 3
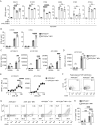
MR1-reactive TCR Vγ9Vδ2 cells are increased in a patient with TCR γδ cell lymphocytosis. (A) Characterization of T cell populations derived from patient’s PBMCs. Flow cytometry plots of TCR Vδ1 vs. TCR Vδ2 expression on total T cells (left panel) and TCR Vδ3 vs. TCR αβ expression on TCR Vδ1/ Vδ2 cells (right panel). Numbers indicate the percentage of cells in the gated areas. (B) Percentages of the T cell populations based on TCR aβ and Vδ expression by flow cytometry. Each dot represents a technical replicate. The bar is the median of the independent measurements. (C) CD4 and CD8 expression on total T cells (black dots) or total TCR Vδ2 cells (superimposed red dots). Numbers indicate CD4 and CD8 cell percentages in each quadrant according to the color. (D) Percentages of naïve (TN), central memory (TCM), effector memory (TEM), and effector memory RA+ (TEMRA) T cells in TCR Vδ2 cells from PBMCs of two healthy controls (HC) and the patient (red). Each dot represents a different donor. (E) Expression of the markers KLRG1, CD161, PD-1, TIGIT, CD26, CD69, CD95, CD28, CD57, NKp80, and CD56 on PBMC-derived TCR Vδ2 cells from HCs (black) and patient (red). Each dot represents a different donor. (F) UMAP of TCR Vδ2 cells from two HCs and the patient distributed in clusters 1 to 15 according to TCR Vδ2, CD161, CD26, CD69, CD95, CD28, CD57, NKp80, and CD56 expression. (G) Activation of ex vivo patient’s PBMC-isolated T cells challenged with MR1-coated or uncoated beads. Flow cytometry plots of CD69 and CD137 expression on TCR Vδ2-gated cells (top plots) or TCR αβ-gated cells (bottom plots). Numbers indicate the percentage of positive cells in the gated area. (H) Activation of the patient-derived TCR γδ cells stimulated or not with PMA/ionomycin and with MR1-coated or uncoated beads. Flow cytometry plots of intracellular IFN-γ, TNF-α, IL-2, or GM-CSF (y-axis) and surface TCR Vδ2 (x-axis).
Figure 4
Figure 4
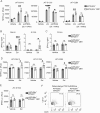
MR1 blocking reduces TCR Vγ9Vδ2 cell activation, and TCR Vγ9Vδ2 transfer recapitulates MR1 recognition. (A) Response of the indicated TCR Vγ9Vδ2 cell clones to A375 WT pulsed with Zol for 4 h in the presence or absence of anti-MR1 or anti-HLA A, B, C mAbs. Data is representative of three independent experiments. Bar plots of IFN-γ release mean ± SD of at least triplicate independent cultures. One-way ANOVA, Dunnet’s multiple comparisons test. ∗∗ p < 0.01; ∗∗∗ p < 0.001; ∗∗∗∗ p < 0.0001; ns, not significant. (B) Response of the TCR Vγ9Vδ2 clones D1C55, and D1B4 when stimulated with A375 β2m cells (black bars) and A375 β2m MR1 cells (white bars) pulsed with Zol. Data is representative of three independent experiments. IFN-γ measurement is the mean ± SD of quadruplicate independent cultures. Two-way ANOVA, Sidak’s multiple comparisons test. ∗∗∗∗ p < 0.0001; ns, not significant. (C, D) Activation of JKT cells expressing (C) MR1-reactive TCRs Vγ9Vδ2 (D9A10, D1C55, G2B9) and (D) the non-MR1-reactive TCRs Vγ9Vδ2 (D15A3) challenged with A375 β2m cells or A375 β2m MR1 cells exposed to Zol or vehicle. Data is representative of three independent experiments. Plots show the RLU mean ± SD of at least triplicate independent cultures. Two-way ANOVA, Sidak’s multiple comparisons test. ∗∗ p< 0.01; ∗∗∗ p < 0.001; ∗∗∗∗ p < 0.0001; ns, not significant. (E) Activation of JKT cells expressing the MR1-reactive TCR Vγ9Vδ2 (D9A10) and non-MR1-reactive TCRs Vγ9Vδ2 (D15A3) challenged with A375 β2m cells (black dots) or A375 β2m MR1 cells (white dots) exposed to increasing doses of Zol. Data is representative of three independent experiments. Plots show the RLU mean ± SD of triplicate independent cultures. Two-way ANOVA, Sidak’s multiple comparisons test. ∗∗∗ p < 0.001; ∗∗∗∗ p < 0.0001. (F) Activation of the patient-derived TCR γδ cell line stimulated with untreated A375 β2m or A375 β2m MR1 cells. Flow cytometry plots of CD25 (x-axis) and CD137 (y-axis) expression on TCR Vδ2-gated cells. Numbers indicate the percentage of positive cells positive in the gated areas. The plots are representative of two independent experiments. (G) Flow cytometry plots of CD69 and CD137 expression on T cells from tg mice expressing a human TCR Vγ9Vδ2. Tg mouse T cells were stimulated with A375 β2m, or A375 β2m MR1 untreated or treated with Zol. Numbers indicate the percentages of cells in each quadrant. Data is representative of four independent experiments. (H) Percentage of TCR Vγ9Vδ2 tg mouse cells that upregulated CD69 in the presence of A375 β2m or A375 β2m MR1 exposed to Zol or vehicle. Bar plot of mean ± SD of four independent experiments. Each dot represents one experiment and is matched across conditions. Two-way ANOVA, matching measurements, uncorrected Fisher’s LSD test. ∗∗ p< 0.01; ∗∗∗ p < 0.001; ns, not significant.
Figure 5
Figure 5
TCRs Vγ9Vδ2 recognize MR1 in the absence of BTN3A1. (A) Activation of JKT cells expressing MR1-reactive TCRs Vγ9Vδ2 (D9A10, D1C55, G2B9) challenged with A375 β2m cells or A375 β2m MR1 cells exposed to Zol, BTN3A mAbs (clone 20.1) or vehicle. Data is representative of three independent experiments. Plots show the RLU mean ± SD of at least triplicate independent cultures. Two-way ANOVA, Sidak’s multiple comparisons test. ∗∗ p< 0.01; ∗∗∗∗ p < 0.0001; ns, not significant. (B, C) Response of (B) MR1-reactive (D9A10, D1C55) and (C) non-MR1-reactive (D15A3) TCR Vγ9Vδ2 clones to A375 β2m/ BTN3A1 cells and A375 β2m/ BTN3A1 MR1 cells exposed to Zol or vehicle. Data is representative of three independent experiments. Plots show the mean IFN-γ (ng/ml) ± SD of at least triplicate independent cultures. Two-way ANOVA, Sidak’s multiple comparisons test. p < 0.05; ∗∗∗ p < 0.001; ns, not significant. (D, E) Activation of JKT cells expressing (D) MR1-reactive (D9A10, D1C55, G2B9), and (E) non-MR1-reactive (D15A3) TCRs challenged with A375 β2m/ BTN3A1 cells and A375 β2m/ BTN3A1 MR1 cells exposed to Zol or vehicle. Data is representative of three independent experiments. Plots show the RLU mean ± SD of at least triplicate independent cultures. Two-way ANOVA, Sidak’s multiple comparisons test. p < 0.05; ns, not significant. (F) Activation of the patient-derived TCR γδ cell line stimulated with untreated A375 β2m/ BTN3A1 cells or A375 β2m/ BTN3A1 MR1 cells. Flow cytometry plots of CD25 and CD137 expression on TCR Vδ2 gated cells. Numbers indicate the percentage of positive cells. The plots are representative of two independent experiments.
Figure 6
Figure 6
The MR1-presented Ag influences the interaction with the TCR and the activation of TCR Vγ9Vδ2 cells. (A) Expression of MR1 on the surface of A375 WT and A375 β2m MR1 cells measured by flow cytometry after 4 h of pulsing with vehicle, Zol, or Ac-6-FP. The median fluorescence intensity (MFI) of each staining is indicated in the respective histogram. (B) Summary of MR1 fold change on A375 WT and A375 β2m MR1 cells as in (A). MR1 fold change was assessed by normalizing Zol and Ac-6-FP conditions with MFI observed for the vehicle condition. Bar plots illustrate the mean ± SD of at least three independent experiments. Each dot corresponds to one experiment. Two-tailed sample t-test. p < 0.05; ∗∗ p< 0.01. (C, D) Activation of JKT cells expressing (C) MR1-reactive TCRs (D9A10, D1C55, G2B9) and (D) non-MR1-reactive TCRs (D15A3) challenged with A375 β2m MR1 cells pre-incubated with Ac-6-FP and exposed or not to Zol. Data is representative of three independent experiments. Bar plots illustrate the RLU mean ± SD of at least triplicate cultures. One-way ANOVA, Dunnet’s multiple comparisons test. p < 0.05; ∗∗∗∗ p < 0.0001; ns, not significant. (E, F) Activation of JKT cells expressing (E) MR1-reactive TCRs (D9A10, D1C55, G2B9) and (F) non-MR1-reactive TCRs (D15A3) challenged with A375 β2m cells pre-incubated with Ac-6-FP and exposed or not to Zol. Data is representative of three independent experiments. Bar plots illustrate the RLU mean ± SD of at least triplicate cultures. One-way ANOVA, Dunnet’s multiple comparisons test. ns, not significant. (G) Summary of MR1 expression on the surface of coated and uncoated beads in the presence or absence of Ac-6-FP. Bar plot of MFI mean ± SD of three independent experiments. Each dot corresponds to one experiment. One-way ANOVA, Dunnet’s multiple comparisons test. p < 0.05; ∗∗ p< 0.01; ns, not significant. (H) D9A10 TCR tetramer staining of uncoated or MR1-coated beads after pre-treatment or not with Ac-6-FP. Histograms are representative of three independent experiments. MFI is indicated next to each histogram. (I) Summary of D9A10 TCR tetramer staining of uncoated or MR1-coated beads in the absence and presence of Ac-6-FP. TCR tetramer MFI was normalized to uncoated beads. Bar plot of mean ± SD of three independent experiments. Each dot corresponds to one experiment. One-way ANOVA, Dunnet’s multiple comparisons test. p < 0.05; ∗∗ p< 0.01.
Figure 7
Figure 7
Mutant MR1 K43A stimulates the D9A10 clone better than MR1 WT. (A) Activation of D9A10 and D15A3 cell clones using beads coated or not with soluble MR1 WT or K43A mutant. Both clones were stimulated with A375 cells treated with Zol (10µM) as a positive control. Data is representative of three independent experiments. Bar plots of IFN-γ release mean ± SD of triplicate independent cultures. One-way ANOVA, Dunnett’s multiple comparisons test. p< 0.05; ∗∗∗∗ p< 0.0001; ns, not significant. (B) Activation of D9A10 upon challenge with MR1 WT-, MR1 K43A-coated or uncoated beads. As a positive control, the clone was challenged using A375 cells treated with Zol (10µM). Flow cytometry plots show the expression of CD3 (x-axis) and CD137 (y-axis). Numbers indicate percentages of cells in the quadrants. Data is representative of three independent experiments. (C) Activation of D9A10 clone using beads coated or not with soluble MR1 K43A, in the presence or absence of anti-MR1 or isotype-matched mAbs. As a positive control, the clone was challenged with A375 cells treated with Zol (10µM). Data is representative of three independent experiments. Bar plots of IFN-γ release mean ± SD of triplicate independent cultures. One-way ANOVA, Dunnett’s multiple comparisons test. ∗∗∗∗ p< 0.0001; ns, not significant. (D) Intracellular staining of IFN-γ and TNF-α in D9A10 clone after stimulation using beads coated or not with soluble MR1 K43A, in the presence or absence of anti-MR1 or isotype-matched mAbs. As a positive control, the clone was challenged with A375 cells treated with Zol (10µM). Data is representative of three independent experiments. (E) Staining of MR1 K43A-coated or uncoated beads using D9A10 TCR tetramer in the presence or absence of anti-MR1 or isotype-matched mAbs. Histograms are representative of at least three independent experiments. Median fluorescence intensity (MFI) is indicated next to each histogram. (F) Summary of D9A10 TCR tetramer staining of MR1 K43A-coated or uncoated beads in the absence and presence of anti-MR1 or isotype-matched mAbs. TCR tetramer MFI was normalized to uncoated beads. Bar plot of mean ± SD of at least three independent experiments. Each dot represents an independent experiment. One-way ANOVA, Dunnet’s multiple comparisons test. p< 0.05; ns, not significant. (G) Activation of the D9A10 clone challenged with A375 β2m cells and A375 β2m MR1 K43A cells in the presence or absence of anti-MR1 or isotype-matched mAbs. As a positive control, the clone was challenged with A375 cells treated with Zol (10µM). Data is representative of three independent experiments. Bar plots of IFN-γ release mean ± SD of triplicate independent cultures. One-way ANOVA, Dunnett’s multiple comparisons test. p< 0.05; ∗∗∗∗ p< 0.0001. (H) Intracellular staining of IFN-γ and TNF-α in D9A10 clone challenged with A375 β2m cells and A375 β2m MR1 K43A cells, in the presence or absence of anti-MR1 or matched isotype mAbs. As a positive control, the clone was challenged using A375 cells treated with Zol (10µM). Numbers indicate percentages of cells in the quadrants. Data is representative of three independent experiments. (I) Activation of JKT cells expressing MR1-reactive TCRs (D9A10, D1C55, G2B9) and non-MR1-reactive TCRs (D15A3) challenged with A375 β2m cells and A375 β2m MR1 K43A cells, in the presence or absence of anti-MR1 or isotype-matched mAbs. As a positive control, the clone was challenged with A375 cells treated with Zol (10µM). Data is representative of three independent experiments. Bar plots illustrate the RLU mean ± SD of triplicate cultures. One-way ANOVA, Dunnet’s multiple comparisons test. ∗∗∗ p < 0.001; ∗∗∗∗ p < 0.0001; ns, not significant.
Figure 8
Figure 8
The Vδ2 CDR3 is relevant for MR1 recognition. (A, B) Gene usage and amino acid sequences of the (A) CDR γ and (B) CDR δ of MR1-reactive and non-MR1-reactive TCR Vγ9Vδ2 cell clones. (C) Activation of JKT cells expressing MR1-reactive (D1B4) and non-MR1-reactive (D9B2) TCRs Vγ9Vδ2 challenged with A375 β2m cells (black bars) or A375 β2m MR1 cells (white bars) exposed to Zol or vehicle. Data is representative of three independent experiments. Plots show the RLU mean ± SD of quadruplicate independent cultures. Two-way ANOVA, Sidak’s multiple comparisons test. p< 0.05; ns, not significant. (D, E) Activation of JKT cells expressing MR1-reactive (D1B4) and non-MR1-reactive (D9B2) TCRs challenged with (D) A375 β2m MR1 cells, or (E) A375 β2m cells pre-incubated with Ac-6-FP and exposed or not to Zol. Data is representative of three independent experiments. Bar plots illustrate the RLU mean ± SD of at least triplicate cultures. One-way ANOVA, Dunnet’s multiple comparisons test. ∗∗ p < 0.01; ∗∗∗ p < 0.001; ns, not significant.
Figure 9
Figure 9
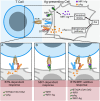
Scheme of TCR Vγ9Vδ2 recognition of BTNs in the presence of pAgs or of MR1-Ag complexes. Proposed model of Zol effects on T cell activation. Zol exposure induces changes in the mevalonate pathway that lead to pAg accumulation and other cellular changes, including oxidative stress (upper panel). (A) In the presence of pAg, the TCR interacts with BTN2A1 homodimers and BTN3A1/3A2 heterodimers. (B) Some TCR Vγ9Vδ2 interact with MR1-Ag complexes. (C) When both pAg and stimulating MR1-Ag complexes engage the TCRs on the same cell, the T cell response increases.

References

    1. Parra-Cuadrado JF, Navarro P, Mirones I, Setien F, Oteo M, Martinez-Naves E. A study on the polymorphism of human MHC class I-related MR1 gene and identification of an MR1-like pseudogene. Tissue Antigens. (2000) 56:170–2. doi: 10.1034/j.1399-0039.2000.560211.x - DOI - PubMed
    1. Huang S, Martin E, Kim S, Yu L, Soudais C, Fremont DH, et al. . MR1 antigen presentation to mucosal-associated invariant T cells was highly conserved in evolution. Proc Natl Acad Sci. (2009) 106:8290–5. doi: 10.1073/pnas.0903196106 - DOI - PMC - PubMed
    1. Porcelli S, Yockey CE, Brenner MB, Balk SP. Analysis of T cell antigen receptor (TCR) expression by human peripheral blood CD4-8- alpha/beta T cells demonstrates preferential use of several V beta genes and an invariant TCR alpha chain. J Exp Med. (1993) 178:1–16. doi: 10.1084/jem.178.1.1 - DOI - PMC - PubMed
    1. Tilloy F, Treiner E, Park SH, Garcia C, Lemonnier F, de la Salle H, et al. . An invariant T cell receptor alpha chain defines a novel TAP-independent major histocompatibility complex class Ib-restricted alpha/beta T cell subpopulation in mammals. J Exp Med. (1999) 189:1907–21. doi: 10.1084/jem.189.12.1907 - DOI - PMC - PubMed
    1. Treiner E, Duban L, Bahram S, Radosavljevic M, Wanner V, Tilloy F, et al. . Selection of evolutionarily conserved mucosal-associated invariant T cells by MR1. Nature. (2003) 422:164–9. doi: 10.1038/nature01433 - DOI - PubMed

MeSH terms

Substances

LinkOut - more resources