Review
. 2024 Jun 10;5(1):20230052.
doi: 10.1002/EXP.20230052. eCollection 2025 Feb.

Advanced electrocatalysts for fuel cells: Evolution of active sites and synergistic properties of catalysts and carrier materials

Affiliations
Review

Advanced electrocatalysts for fuel cells: Evolution of active sites and synergistic properties of catalysts and carrier materials

Zhijie Kong et al. Exploration (Beijing). .

Abstract

Proton exchange-membrane fuel cell (PEMFC) is a clean and efficient type of energy storage device. However, the sluggish reaction rate of the cathode oxygen reduction reaction (ORR) has been a significant problem in its development. This review reports the recent progress of advanced electrocatalysts focusing on the interface/surface electronic structure and exploring the synergistic relationship of precious-based and non-precious metal-based catalysts and support materials. The support materials contain non-metal (C/N/Si, etc.) and metal-based structures, which have demonstrated a crucial role in the synergistic enhancement of electrocatalytic properties, especially for high-temperature fuel cell systems. To improve the strong interaction, some exciting synergistic strategies by doping and coating heterogeneous elements or connecting polymeric ligands containing carbon and nitrogen were also shown herein. Besides the typical role of the crystal surface, phase structure, lattice strain, etc., the evolution of structure-performance relations was also highlighted in real-time tests. The advanced in situ characterization techniques were also reviewed to emphasize the accurate structure-performance relations. Finally, the challenge and prospect for developing the ORR electrocatalysts were concluded for commercial applications in low- and high-temperature fuel cell systems.

Keywords: active site; electrocatalyst; low/high‐temperature fuel cell; oxygen reduction reaction; synergistic property.


Conflict of interest statement

The authors declare no conflicts of interest.

Figures

FIGURE 1
FIGURE 1
Coordination and synergistic effects of Pt‐based electrocatalysts on fuel cells. STEM images of TMC@Pt NPs were captured (A–C) before and (D–F) after durability tests. (G) The evolution process of partially and fully core@shell NPs with Pt‐shell during long‐term cycling in the schematic illustration. Reproduced with permission.[ 81 ] Copyright 2020, Nature Publishing Group. (H) TEM and HRTEM images of PtNi NWs with bunched alloy nanocages and defects. Reproduced with permission.[ 86 ] Copyright 2019, AAAS. (I) The 3D RMC models of PtNi and Mo‐doped PtNi NPs during the accelerated durability test. (J) The performance of octahedral PtNi/C and Mo‐PtNi/C regarding MAs and SAs at 0.9 V (vs RHE). Reproduced with permission.[ 87 ] Copyright 2015, AAAS.
FIGURE 2
FIGURE 2
The role of phase structure engineering of Pt‐based electrocatalysts on fuel cells. (A) The schematic diagram of the structural changes in the PdNi/C NP electrocatalyst during the ADT test. (B) Intermetallic distance oscillatory phenomenon versus the potential cycles. Reproduced with permission.[ 94 ] Copyright 2015, American Chemical Society. (C) Illustration of phase structure changes in PdCu nanoparticles. (D) Atomic PDFs from crystal structure models and experiments of various catalysts. (E) ORR curves of Pd50Cu50/C‐400°C and Pd50Cu50/C‐100°C catalysts in the ADT process. Reproduced with permission.[ 95 ] Copyright 2018, American Chemical Society. The relationship between performance and the degree of phase segregation of Pd(1‐ x )Au( x y )Pt z @AuyPt(1‐ z ) NW, related to the fcc sites, (F) without segregation, (G) partial segregation, (H) completed segregation. The X‐axis from left to right is Pt, Pt@Pd, Pd0.88Pt0.19 @Au0.12Pt0.81, Pd0.77Pt0.38@Au0.23Pt0.62, Pd0.69Pt0.52@Au0.31Pt0.48. Reproduced with permission.[ 99 ] Copyright 2015, American Chemical Society.
FIGURE 3
FIGURE 3
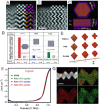
The role of crystal facet engineering of Pt‐based electrocatalysts on fuel cells. (A,B) The high resolution of HAADF images of single hexagonal PtPb nanoplates superposed with atomic models and simulated images on the experimental images. (C) The nanoplate illustrations demonstrate the top interface [(110)Pt//(100)PtPb] and side interface [(110)Pt//(001)PtPb]. (A‐C) Reproduced with permission.[ 100 ] Copyright 2016, AAAS. (D) The d‐band center position obtained from the UPS spectrum based on the surface facet of Pt(hkl) and Pt3Ni(hkl). Adapted with permission.[ 61 ] Copyright 2007, AAAS. (E) The changes of composition and morphology for Pt x Ni1‐ x NPs. Reproduced with permission.[ 104 ] Copyright 2013, Springer Nature. (F) Polarization curves of the Pt3Co hierarchical NWs/C catalyst for ORR in 10,000, 15,000, and 20,000 accelerated durability experiments in different potentials versus RHE. (G) Images of HAADF‐STEM and the corresponding EDS of the Pt3Co hierarchical NWs. Reproduced with permission.[ 105 ] Copyright 2016, Springer Nature.
FIGURE 4
FIGURE 4
Effect of lattice strain on the performance of fuel cells. (A) EDX mapping and HAADF images for twisty PtFe NWs, (B) the ORR polarization curves and MAs in the ADT process (insets). (C) the relationship between the lattice constant and potential cycling number in PEMFCs over in situ synchrotron XRD, combined with the RMC model (insets). Reproduced with permission.[ 23 ] Copyright 2020, American Chemical Society. (D) The relationship between H3PO4 adsorption and the compressive strain induced by Cu dopant. (E) The power density of Cu‐PtFe/NC in H2‐O2 and H2‐air.[ 30 ] Copyright 2021, John Wiley and Sons.
FIGURE 5
FIGURE 5
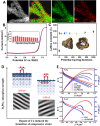
The role of metal‐containing (M‐N‐C) electrocatalysts on fuel cells. (A) The multiwalled carbon nanotube (MWCNT) was added to connect the NPs and enable electron conduction during the ZIF preparation. Reproduced with permission.[ 117 ] Copyright 2016, John Wiley and Sons. (B) The performance of NPC‐4‐1100‐Zn and NPC‐4‐1100 electrocatalysts in PEMFC cells. Reproduced with permission.[ 124 ] Copyright 2018, Elsevier B.V. (C) The accelerated test of the Fe/N/C catalyst and metal‐free N‐G‐CNT+KB over 0.5 V in PEMFCs. Reproduced with permission.[ 129 ] Copyright 2015, AAAS.
FIGURE 6
FIGURE 6
The role of metal‐free (carbon‐based) electrocatalysts on fuel cells. (A) Micro‐area electrochemical platform drawn in schematic image. (B) ORR performance edge and basal area for HOPG. Reproduced with permission.[ 139 ] Copyright 2014, John Wiley and Sons. (C) Graphene diagram loading on carbon fiber etched with rich‐defect edge by plasma. Reproduced with permission.[ 55 ] Copyright 2017, John Wiley and Sons. (D) Using an acetyl group, N‐doped graphene nanomaterial was prepared by the location‐specific modification of the pyridinic‐N and ortho‐C atoms. The modified pyridinic‐N and ortho‐C are labeled as N_Ac (blue) and C_Ac (red), respectively. (E) Polarization curves of ORR under the 0.1 M H2SO4 electrolyte in the saturated O2. (D, E) Adapted with permission.[ 140 ] Copyright 2018, American Chemical Society. (F) Schematic diagrams of the GNR@CNT. (G) The relationship between the power density and cell voltage curves as a function versus current density for different catalysts. Reproduced with permission.[ 141 ] Copyright 2018, Springer Nature Publishing.
FIGURE 7
FIGURE 7
Synergistic strategies by surface functionalization: anchor and physical encapsulation. (A) TEM and (B) the HRTEM image of CNC and Pt/CNC; (C) Polarization curves of Pt/CNC before and after accelerated durability tests. (A–C) Reproduced with permission.[ 151 ] Copyright 2014, Springer Nature. (D) Effect of N modification on ionomer distribution and performance in fuel cell. (E) N modification program of Pt/KB before and after thermal treatment. Reproduced with permission.[ 152 ] Copyright 2020, Springer Nature. (F) HAADF‐STEMs and the corresponding HRTEM images in N2 and Ar under thermal treatment. (G) Cyclic voltammogram and (H) ORR polarization curve before and after different thermal treatments for the PtNi/C catalyst. (F–H) Reproduced with permission.[ 153 ] Copyright 2019, American Chemical Society.
FIGURE 8
FIGURE 8
Strong interaction by surface functionalization: chemical bonding. (A) Fe/N/C ORR catalyst with doped sulfur synthesized using the poly‐m‐phenylenediamine, Fe(SCN)3 and carbon black (left); the relationship between the power density and polarization curve tested in a MEA with the S‐doped Fe/N/C cathode catalyst (right). Reproduced with permission.[ 159 ] Copyright 2015, John Wiley and Sons. (B) Schematic illustration for the MWCNTs/PVP/Pt catalyst synthesis process with PVP; Reproduced with permission.[ 164 ] Copyright 2013, Royal Society of Chemistry. (C) Schematic program of the as‐synthesized catalysts, (D) the corresponding CNT/ABPBI/Pt@IL image. Reproduced with permission.[ 172 ] Copyright 2018, John Wiley and Sons. (E) Synthetic program, and (F) corresponding HRTEM image of ordered fct PtFe nanoparticle coated N‐doped‐carbon. (E, F) Reproduced with permission.[ 173 ] Copyright 2015, American Chemical Society.
FIGURE 9
FIGURE 9
Strong synergy between PGM catalysts and oxides and metal carbide carriers. (A) Schematic diagram of silicon dioxide and carbon nanotubes working together as carrier materials for Pt nanoparticles in HT‐PEMFCs. Reproduced with permission.[ 180 ] Copyright 2021, China Society of Chemistry. (B) MnCo2O4/C catalysts with varying metal loading are available for H2/O2 AMFC performance. Reproduced with permission.[ 181 ] Copyright 2019, American Society of Chemistry. (C) The SiCTiC carrier exhibited excellent durability compared to the Vulcan support in HT‐PEMFCs. Reproduced with permission.[ 184 ] Copyright 2017, American Society of Chemistry.
FIGURE 10
FIGURE 10
In situ characterization technique. (A) Line scan of STM over Pt(111) facet in PEMFCs cell. Reproduced with permission.[ 191 ] Copyright 2017, Springer Nature. (B) In situ XRD test under various potentials for Pt/C catalyst, and (C) the corresponding function of nanoparticle size versus different potentials. (D) In situ XAS absorption cell and (E) the corresponding Pt L‐edge spectrum of PtCo under different potentials. (B‐E) Reproduced with permission.[ 200 ] Copyright 2016, American Chemical Society. (F,G) HAADF‐STEM and EDX mapping images of Pt‐Rh‐Ni octahedral nanoparticles after different ADT tests. Reproduced with permission.[ 89 ] Copyright 2016, American Chemical Society. In situ SHINERS spectra obtained from (H) Pt (111), (I) Pt (100), and (J) Pt (110) surfaces under the ORR environment. Adapted with permission.[ 210 ] Copyright 2018, Springer Nature.

References

    1. Xiao F., Wang Y.‐C., Wu Z.‐P., Chen G., Yang F., Zhu S., Siddharth K., Kong Z., Lu A., Li J.‐C., Zhong C.‐J., Zhou Z.‐Y., Shao M., Adv. Mater. 2021, 33, 2006292. - PubMed
    1. Yang L., Shui J., Du L., Shao Y., Liu J., Dai L., Hu Z., Adv. Mater. 2019, 31, e1804799. - PubMed
    1. Shao Q., Wang P., Zhu T., Huang X., Acc. Chem. Res. 2019, 52, 3384. - PubMed
    1. Li W., Wang D., Zhang Y., Tao L., Wang T., Zou Y., Wang Y., Chen R., Wang S., Adv. Mater. 2020, 32, e1907879. - PubMed
    1. Huang L., Zaman S., Tian X., Wang Z., Fang W., Xia B. Y., Acc. Chem. Res. 2021, 54, 311. - PubMed

LinkOut - more resources