. 2024 Oct 28;5(1):57-74.
doi: 10.1016/j.jncc.2024.10.001. eCollection 2025 Feb.

Overexpression of ornithine decarboxylase 1 mediates the immune-deserted microenvironment and poor prognosis in diffuse large B-cell lymphoma

Affiliations

Overexpression of ornithine decarboxylase 1 mediates the immune-deserted microenvironment and poor prognosis in diffuse large B-cell lymphoma

Xiaojie Liang et al. J Natl Cancer Cent. .

Abstract

Background: Previous researches mainly focused on whether cancer stem cells exist in diffuse large B-cell lymphoma (DLBCL). However, subgroups with dismal prognosis and stem cell-like characteristics have been overlooked.

Methods: Using large scale data (n = 2133), we conducted machine learning algorithms to identify a high risk DLBCL subgroup with stem cell-like features, and then investigated the potential mechanisms in shaping this subgroup using transcriptome, genome and single-cell RNA-seq data, and in vitro experiments.

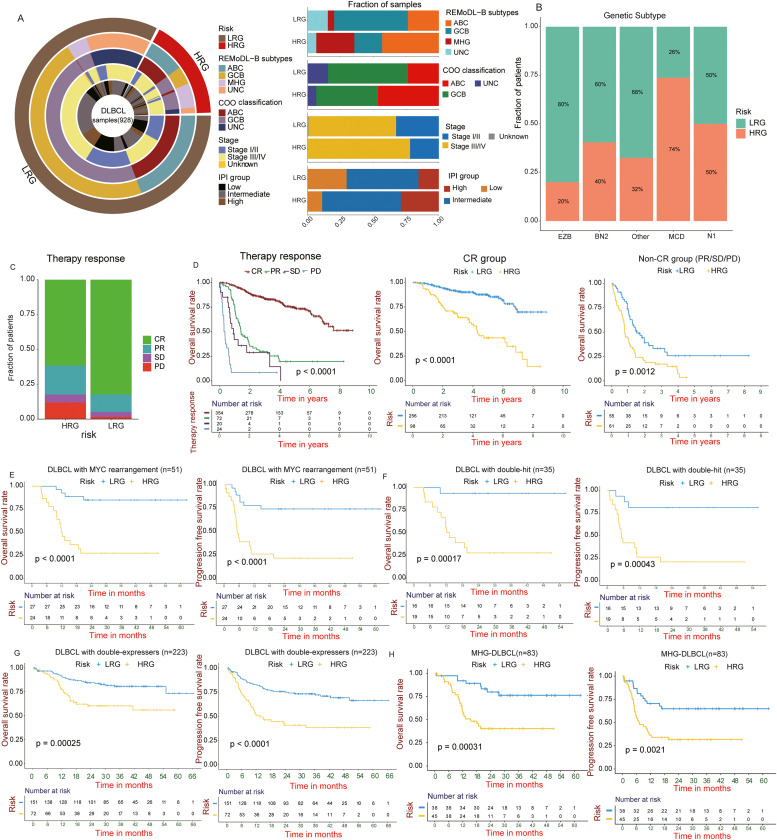
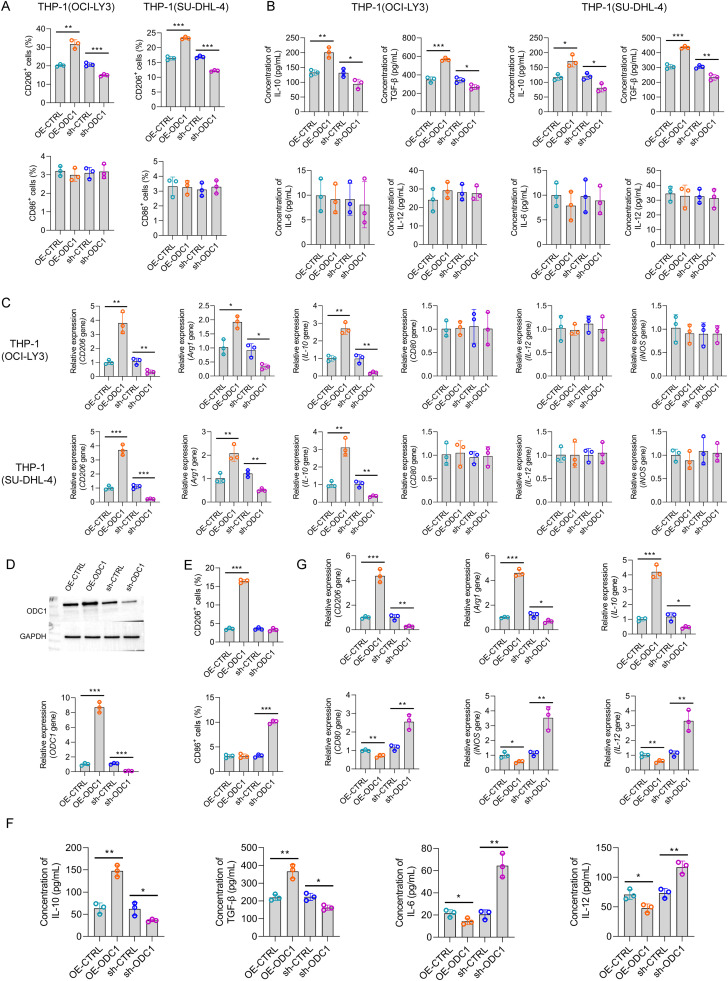
Results: We identified a high-risk subgroup (25.6 % of DLBCL) with stem cell-like characteristics and dismal prognosis. This high-risk group (HRG) was featured by upregulation of key enzyme (ODC1) in polyamine metabolism and cold tumor microenvironment (TME), and had a poor prognosis with lower 3-year overall survival (OS) (54.3 % vs. 83.6 %, P < 0.0001) and progression-free survival (PFS) (42.8 % vs. 74.7 %, P < 0.0001) rates compared to the low-risk group. HRG also exhibited malignant proliferative phenotypes similar to Burkitt lymphoma. Patients with MYC rearrangement, double-hit, double-expressors, or complete remission might have either favorable or poor prognosis, which could be further distinguished by our risk stratification model. Genomic analysis revealed widespread copy number losses in the chemokine and interferon coding regions 8p23.1 and 9p21.3 in HRG. We identified ODC1 as a therapeutic vulnerability for HRG-DLBCL. Single-cell analysis and in vitro experiments demonstrated that ODC1 overexpression enhanced DLBCL cell proliferation and drove macrophage polarization towards the M2 phenotype. Conversely, ODC1 inhibition reduced DLBCL cell proliferation, induced cell cycle arrest and apoptosis, and promoted macrophage polarization towards the M1 phenotype. Finally, we developed a comprehensive database of DLBCL for clinical application.

Conclusions: Our study effectively advances the precise risk stratification of DLBCL and reveals that ODC1 and immune-deserted microenvironment jointly shape a group of DLBCL patients with stem cell-like features. Targeting ODC1 regulates immunotherapies in DLBCL, offering new insights for DLBCL treatment.

Keywords: DLBCL; Immunotherapy; ODC1; Risk stratification; Tumor microenvironment.


Figures

Fig 1
Fig. 1
Oncogenic dedifferentiation-like characteristics in DLBCL. (A, B) Overview of the association between stemness index and known clinical and molecular characteristics in DLBCL training cohort (A) and GSE117556 cohort (B). Columns represent samples sorted by mRNAsi from low to high (top row), and rows represent the demographic and subtype associated with mRNAsi. (C) Difference in mRNAsi among distinct clinical subgroups. Fluorescent in situ hybridization (FISH) tests were used to detect MYC, BCL2 and BCL6 re-arrangement; single-hit represents MYC rearrangement without rearrangement in BCL2 and BCL6; MYC-rearranged NOS represents MYC rearrangement with unknown rearrangement status of BCL2 and BCL6; Double-hit represents rearrangement in MYC and BCL2 and/or BCL6. Expressor_RNA represents samples were assessed for combined high expression of MYC and BCL2 at the mRNA level. Expressor_IHC, represents samples were investigated for MYC and BCL2 protein expression by immunohistochemistry (IHC). (D) Correlation of mRNAsi and core cancer stem cell factors MYC and EZH2. (E) GSEA showing mRNAsi evaluated in the context of gene sets representative for hallmarks of stemness and cancer. (F-I) Survival analysis shows that mRNAsi is closely associated with OS rate of the training cohort (F), PFS rate of the GSE31312 cohort (G), OS (H) and PFS (I) rates of the GSE117556 cohort. OS, overall survival; PFS, progression-free survival. ABC, activated B-cell-like; CR, complete response; DLBCL, diffuse large B-cell lymphoma; ECOG, Eastern Cooperative Oncology Group; F, female; GCB, non-germinal center B cell; IHC, immunohistochemical; M, male; MHG, molecular high-grade; mRNAsi, mRNA expression-based stemness index; nGCB, non-germinal center B cell; NOS, not otherwise specified; PD, progressive disease; PR, partial response; SD, stable disease; UNC, unclassified.
Fig 2
Fig. 2
12-marker-based model demonstrated robust ability in risk stratification of DLBCL. (A, B) Combining the LASSO (A) and SVM-RFE (B) algorithms to select signature genes. (C) 28 overlapped genes selected by the two algorithms shown in a Venn diagram. Subsequently, the 28 genes were integrated into a penalized Cox regression model for both forward and backward feature selection, refining the candidate genes to 12 to construct the Riskscore. (D, E) The Kaplan-Meier curves for overall survival (D) and progression-free survival (E) in the total cohort demonstrated that our risk stratification model had robust risk stratification ability and could stably stratify the risk of DLBCLs. (F, G) The forest plots shows that HRG independently predicted a worse overall survival (F) and progression-free survival (G) in DLBCL after adjusting for clinical covariates. HRG, high-risk group; LRG, low-risk group.
Fig 3
Fig. 3
Distinct clinical characteristics between LRG and HRG DLBCLs. (A) Overlay of risk-model-based subgroups (outer rings) with published known clinical and molecular subtypes (inner ring) (left panel). Bar plots showing the distribution of COO subtypes, REMoDL-B trial subtypes, IPI groups and tumor stage among risk-model-based subgroups (right panel). (B) The percentage of HRG and LRG in each genetic subtype. (C) Proportion of patients with different therapy responses in the HRG and LRG of the GSE31312 cohort (two-tailed Fisher exact test; P = 2.8e-07). (D) According to the stratification of the therapy responses to R-CHOP, the Kaplan-Meier curve of overall survival of DLBCL patients in the GSE31312 cohort (left panel). Survival plots for overall survival showing the stratification of risk model for each of the individual responses to R-CHOP for patients in the CR group (middle panel) and non-CR group (right panel). (E-H) The Kaplan-Meier curves for overall survival and progression-free progression survival in HRG and LRG DLBCL patients with MYC rearrangement (E), double-hit (F), double-expressors assessed by combined high mRNA transcriptional expression of MYC and BCL2 (G), and MHG subtype (H). REMoDL-B, the Randomized Evaluation of Molecular-Guided Therapy for Diffuse Large B-Cell Lymphoma With bortezomib (Bortezomib) clinical trial. ABC, activated B-cell-like; COO, cell-of-origin; CR, complete response; DLBCL, diffuse large B-cell lymphoma; GCB, non-germinal center B cell; HRG, high-risk group; IPI, international prognostic index; LRG, low-risk group; MHG, molecular high-grade; PD, progressive disease; PR, partial response; SD, stable disease; UNC, unclassified.
Fig 4
Fig. 4
Risk-model-based subgroups show distinct transcriptional patterns. (A) The heatmap shows the GSVA enrichment scores of the chosen signatures in LRG and HRG DLBCL of the GSE117556 cohort, and are augmented in 70 patients with BL for comparison of gene expression patterns. (B-E) Differences of angiogenesis and fibrosis (B), anti-tumor immune infiltrate (C), tumor proliferation rate (D) and pro-tumor immune infiltrate (E) among HRG and LRG DLBCL samples of the GSE117556 cohort. (F) Abundance of TME-infiltrating innate and adaptive immune cells among HRG and LRG DLBCL samples of the GSE117556 cohort. (G) Differences of immune score and stromal score between HRG and LRG DLBCL of the training cohort. (H) Differences of cytolytic activity between HRG and LRG DLBCL of the training cohort. (I) Correlation between immune score and Riskscore in the training cohort. For boxplots, the lines in the boxes represent median values and the lower and upper ends of the box represent the interquartile range of values. *P < 0.05; ⁎⁎P < 0.01; ⁎⁎⁎P < 0.001; ⁎⁎⁎⁎P < 0.0001. ABC, activated B-cell-like; COO, cell-of-origin; CR, complete response; DLBCL, diffuse large B-cell lymphoma; ECOG, Eastern Cooperative Oncology Group; GCB, non-germinal center B cell; HRG, high-risk group; IHC, immunohistochemical; IPI, international prognostic index; LRG, low-risk group; MHG, molecular high-grade; NOS, not otherwise specified; PD, progressive disease; PR, partial response; SD, stable disease; UNC, unclassified.
Fig 5
Fig. 5
Genomic alterations of risk-model-based subgroups in DLBCL. (A) Mutation frequencies for 400 patients of LRG and HRG subgroups in REMoDL-B cohort for the 70-gene panel. (B) The Oncoplot shows the mutation types of the 70 genes and their distribution in LRG and HRG DLBCL. The right-side bar chart recapitulates the proportion of each mutation type for each gene. (C) Genomic alterations of 13 cancer hallmark pathways among LRG and HRG DLBCL samples in the REMoDL-B cohort, and the saturation of color represents the frequency (two-tailed Fisher exact test, *P < 0.05;⁎⁎P < 0.01). (D) Comparison of the somatic CNAs between LRG and HRG DLBCL subgroups in the GSE87371 cohort. The top and middle diagrams shows the frequency of the loss/deletion (blue) and gain/amplification (red) of each gene in HRG and LRG, and the bottom diagram shows the log10(P value) of each gene when compared between HRG and LRG in the gain/amplification-centric (yellow) or loss/deletion-centric (green) calculations (two-tailed Fisher exact test). SNV, single-nucleotide variation; DLBCL, diffuse large B-cell lymphoma; HRG, high-risk group; LRG, low-risk group.
Fig 6
Fig. 6
Upregulation of ODC1 promotes the immune-deserted phenotype of HRG-DLBCL. (A) Expression of the 12 genes for constructing the risk model between HRG and LRG. (B) Correlation between each of the 12 genes and each TME infiltration innate and adaptive immune cell type in DLBCL. Blue represents a negative correlation and red represents a positive correlation. (C) Based on the same cut-off value 7.9483, Kaplan-Meier survival analysis for overall survival of multiple cohorts indicates that overexpression of ODC1 is associated with poor prognosis in DLBCL training (left panel), GSE117556 (middle panel) and TCGA-NCICCR (right panel) cohorts. (D) GSEA of inflammatory and interferon response pathways in ODC1 high- versus low-expressing DLBCL. (E) Correlation analysis between ODC1 expression level and GSVA enrichment scores of inflammatory and interferon response pathways in pan-cancer analysis. (F) Expression of two innate immunity-sensing factors, STING and the NLRP3 inflammasome in ODC1 high- versus low-expressing DLBCL. (G) Correlation analysis between ODC1 expression level and chemokine genes in DLBCL. (H) Differences in immune-activated pathways between the high and low ODC1 expression DLBCLs. (I-J) Mean mRNA expression levels of immune co-inhibitors and co-stimulators (I), as well as MHC molecules (J), between ODC1 high- and low-expressing DLBCL. *P < 0.05; ⁎⁎P < 0.01; ⁎⁎⁎P < 0.001; ⁎⁎⁎⁎P < 0.0001. DLBCL, diffuse large B-cell lymphoma; HRG, high-risk group; LRG, low-risk group; NES, normalized enrichment score.
Fig 7
Fig. 7
Impact of ODC1 upregulation on DLBCL tumor cells. (A) Comparison of ODC1 expression in different cell types across 20 single-cell RNA-seq samples and between tumor and normal B cells in various B-cell lymphomas. (B) Comparison of ODC1 expression in tumor cells among DLBCL, FL and tFL. (C) The heatmap show the GSEA normalized enrichment scores of cancer hallmark signatures in ODC1 high- versus low-expressing tumor cells of DLBCL. (D) Boxplots showing the increased transcript count in ODC1 high-expressing tumor cells of DLBCL. (E) The heatmap shows the GSEA normalized enrichment scores of the cell cycle, chemokines, and stem-cell-associated pathways in ODC1 high- and low-expressing tumor cells of DLBCL. (F) The heatmap displays the average expression of genes involved in immune activation and immune cell chemotaxis pathways between ODC1 high- and low-expressing tumor cells. (G) Heatmap of the area under the curve (AUC) scores of expression regulation by transcription factors, as estimated using SCENIC. (H) T-distributed stochastic neighbor embedding (t-SNE) analysis for ODC1 high- and low-expressing tumor cells for the expression of transcriptional factors (top panels), and for the AUC of the estimated regulon activity of these transcription factors (bottom panels), corresponding to the degree of expression regulation of their target genes. (I) Violin plots showing the GSVA enrichment scores of stemness signatures in ODC1 high- versus low-expressing tumor cells of DLBCL. (J) Kaplan-Meier survival analysis demonstrated that ODC1 high-expressing tumor cells were associated with poor prognosis of DLBCL. ⁎⁎⁎⁎P < 0.0001. DLBCL, diffuse large B-cell lymphoma; DC, dendritic cell; FL, follicular lymphoma; Mac, macrophage cell; Mono, monocyte cell; tFL, transformed FL.
Fig 8
Fig. 8
The impact of ODC1 on cell proliferation, cell cycle, and apoptosis in DLBCL cell lines. (A) Plasmid-mediated overexpression (OE-ODC1) and knockdown (sh-ODC1) of ODC1 were performed in DLBCL cell lines OCI-LY3 and SU-DHL-4. ODC1 mRNA (unpaired t-test) and protein expression levels were assessed by qRT-PCR and western blotting. (B, C) The effects of ODC1 overexpression and knockdown on cell viability and proliferation were evaluated using the CCK-8 assay (B, ANOVA test) and colony formation assay (C, unpaired t-test). (D) Cell cycle distribution was measured and quantified by flow cytometry analysis (unpaired t-test). (E) Apoptosis rates were assessed by Annexin V/7-AAD staining and quantified using flow cytometry (unpaired t-test). (F) Representative IHC images of ODC1 expression in DLBCL tissue samples. Scale bar, 50 µm. (G, H) Survival plots of overall survival (G) and progression-free survival (H) for patients with ODC1 positive versus negative-expressing DLBCL (Log-rank test). *P < 0.05; ⁎⁎P < 0.01; ⁎⁎⁎P < 0.001; ⁎⁎⁎⁎P < 0.0001. CTRL, control; OE, overexpression.
Fig 9
Fig. 9
Single-cell analysis indicates that overexpression of ODC1 promotes M2 polarization in DLBCL. (A) Reclustering of macrophages in single-cell samples of DLBCL. (B) Violin plot shows the increased mRNA level of ODC1 in cluster1 macrophages. (C) GO enrichment analysis of cluster0 and cluster1. (D) Dotplot shows the expression of markers of co-stimulatory and MHC molecules, as well as co-inhibitory in cluster0 and cluster1 macrophages. (E) The heatmap shows the GSVA enrichment scores of immune response pathways in cluster0 and cluster1 macrophages (Wilcoxon rank-sum test, *P < 0.05; ⁎⁎P < 0.01; ⁎⁎⁎P < 0.001; ⁎⁎⁎⁎P < 0.0001). (F) GSEA of glycolysis, inflammatory and interferon response pathways in cluster0 and cluster1 macrophages. (G) Violin plots show the expression of markers of M1 and M2 macrophages in cluster0 and cluster1 macrophages. (H) Violin plots of cluster0 and cluster1 macrophages, for the expression of MYC and TCF7L2 (left panel), and for the area under the curve of the estimated regulon activity of these transcription factors (right panel), corresponding to the degree of expression regulation of their target genes. (I) Kaplan-Meier survival analysis demonstrated that cluster1 macrophages were associated with poor prognosis of DLBCL. NES, normalized enrichment score.
Fig 10
Fig. 10
In vitro experiments demonstrate the impact of ODC1 on macrophage polarization. (A) Flow cytometry analysis of CD206+ M2 macrophages and CD86+ M1 macrophages after co-culture of M0 THP-1 cells with DLBCL cell lines overexpressing or knocking down ODC1. (B) ELISA measurement of cytokine levels in the supernatants after co-culture with different DLBCL cell lines. (C) RT-PCR analysis of M1/M2 marker gene expression in macrophages after co-culture with different DLBCL cell lines. (D) Plasmid-mediated overexpression and knockdown of ODC1 in THP-1 cell lines, with western blotting (upper panel) and RT-PCR (lower panel) used to detect ODC1 protein expression and mRNA levels. (E) Flow cytometry analysis of CD206+ M2 macrophages and CD86+ M1 macrophages in THP-1 cells with ODC1 expression discrepancy. (F) ELISA measurement of cytokine levels in the supernatants from THP-1 cells with ODC1 expression discrepancy. (G) RT-PCR analysis of M1/M2 marker gene expression in macrophages from different groups. The unpaired t-test was used to assess statistical differences between two groups. *P < 0.05; ⁎⁎P < 0.01; ⁎⁎⁎P < 0.001; ⁎⁎⁎⁎P < 0.0001.

References

    1. Malta T.M., Sokolov A., Gentles A.J., et al. Machine learning identifies stemness features associated with oncogenic dedifferentiation. Cell. 2018;173:338–354.e15. doi: 10.1016/j.cell.2018.03.034. - DOI - PMC - PubMed
    1. Zhang C., Chen T., Li Z., et al. Depiction of tumor stemlike features and underlying relationships with hazard immune infiltrations based on large prostate cancer cohorts. Brief Bioinform. 2021;22:bbaa211. doi: 10.1093/bib/bbaa211. - DOI - PubMed
    1. Miranda A., Hamilton P.T., Zhang A.W., et al. Cancer stemness, intratumoral heterogeneity, and immune response across cancers. Proc Natl Acad Sci USA. 2019;116:9020–9029. doi: 10.1073/pnas.1818210116. - DOI - PMC - PubMed
    1. Lian H., Han Y.P., Zhang Y.C., et al. Integrative analysis of gene expression and DNA methylation through one-class logistic regression machine learning identifies stemness features in medulloblastoma. Mol Oncol. 2019;13:2227–2245. doi: 10.1002/1878-0261.12557. - DOI - PMC - PubMed
    1. Song S., Li Y., Zhang K., et al. Cancer stem cells of diffuse large B cell lymphoma are not enriched in the CD45+CD19- cells but in the ALDH high cells. J Cancer. 2020;11:142–152. doi: 10.7150/jca.35000. - DOI - PMC - PubMed

LinkOut - more resources