. 2025 Mar 4:13:tkae065.
doi: 10.1093/burnst/tkae065. eCollection 2025.

Single-cell RNA sequencing reveals the impaired epidermal differentiation and pathological microenvironment in diabetic foot ulcer

Affiliations

Single-cell RNA sequencing reveals the impaired epidermal differentiation and pathological microenvironment in diabetic foot ulcer

Yiling Liu et al. Burns Trauma. .

Abstract

Background: Diabetic foot ulcer (DFU) is one of the most common and complex complications of diabetes, but the underlying pathophysiology remains unclear. Single-cell RNA sequencing (scRNA-seq) has been conducted to explore novel cell types or molecular profiles of DFU from various perspectives. This study aimed to comprehensively analyze the potential mechanisms underlying impaired re-epithelization of DFU in a single-cell perspective.

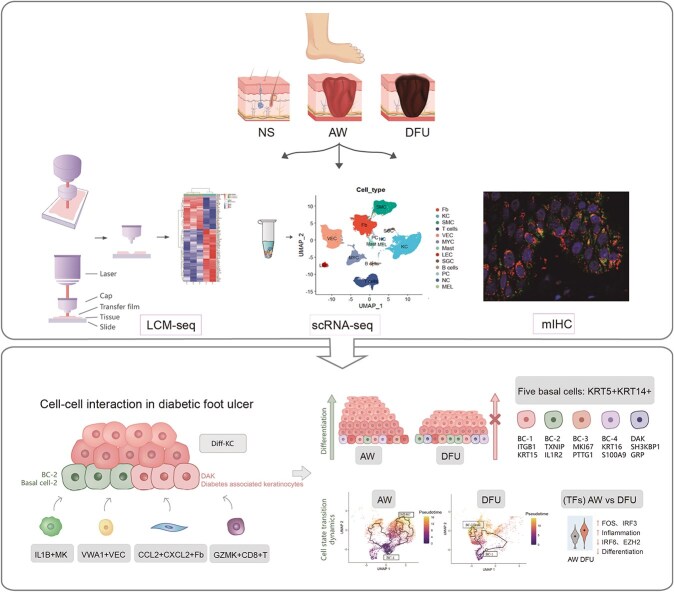
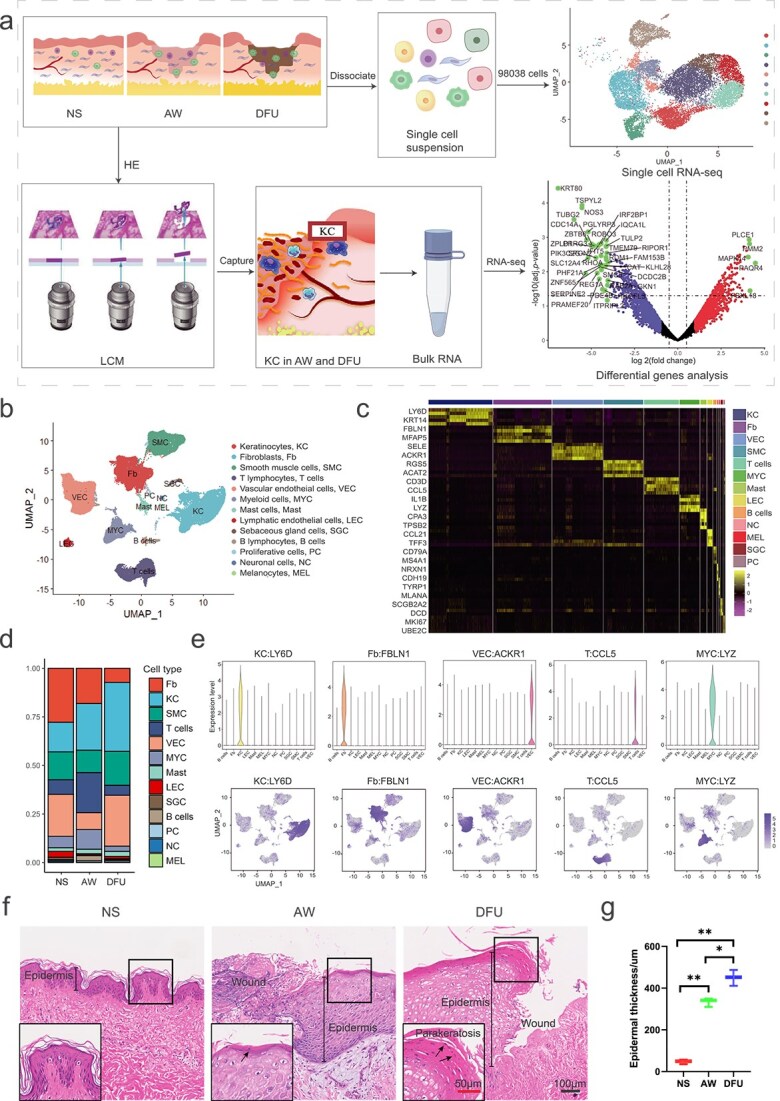
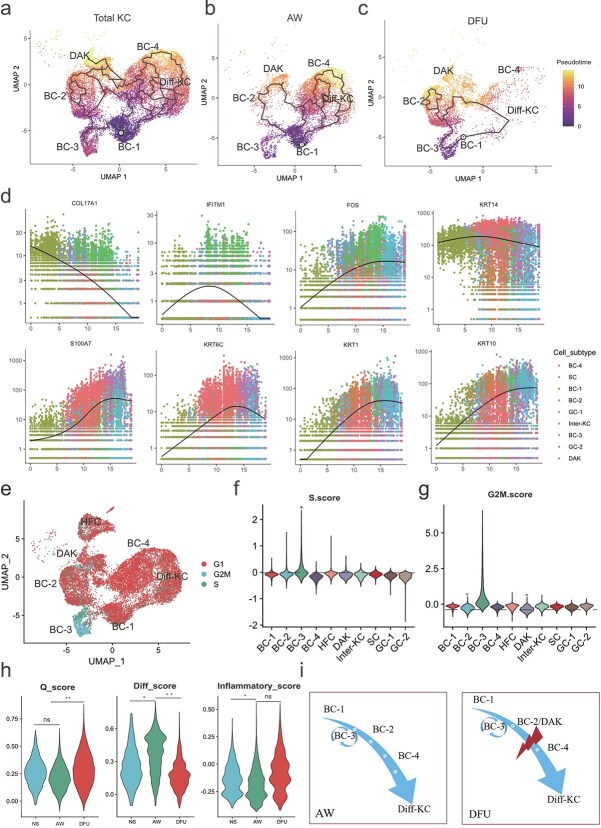
Methods: We conducted scRNA-seq on tissues from human normal skin, acute wound, and DFU to investigate the potential mechanisms underlying impaired epidermal differentiation and the pathological microenvironment. Pseudo-time and lineage inference analyses revealed the distinct states and transition trajectories of epidermal cells under different conditions. Transcription factor analysis revealed the potential regulatory mechanism of key subtypes of keratinocytes. Cell-cell interaction analysis revealed the regulatory network between the proinflammatory microenvironment and epidermal cells. Laser-capture microscopy coupled with RNA sequencing (LCM-seq) and multiplex immunohistochemistry were used to validate the expression and location of key subtypes of keratinocytes.

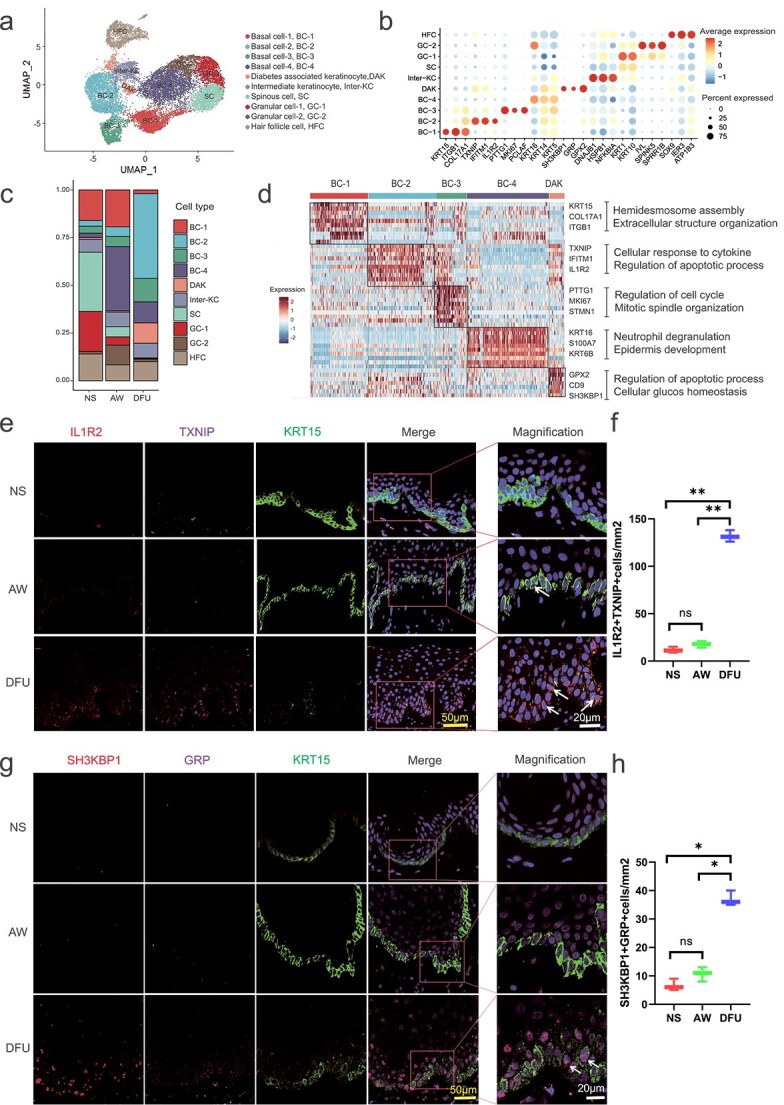
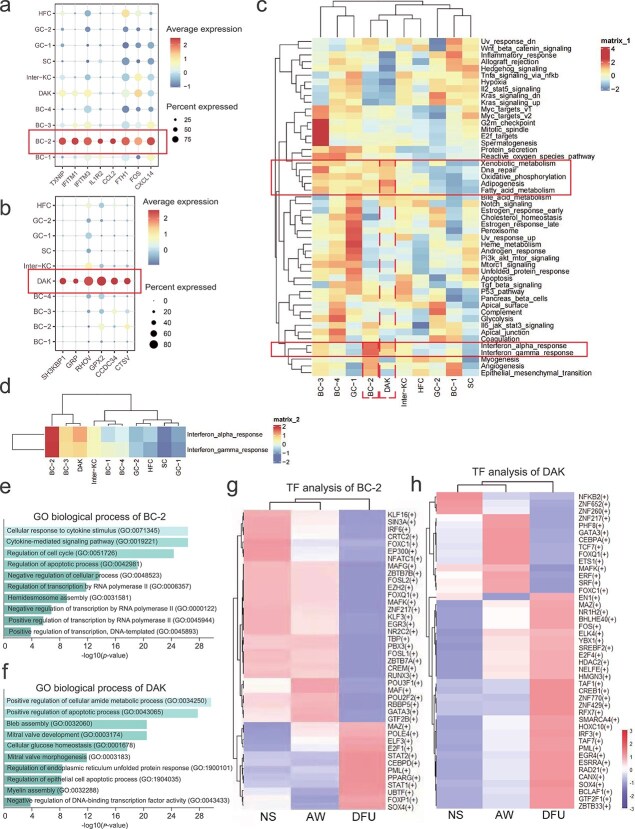
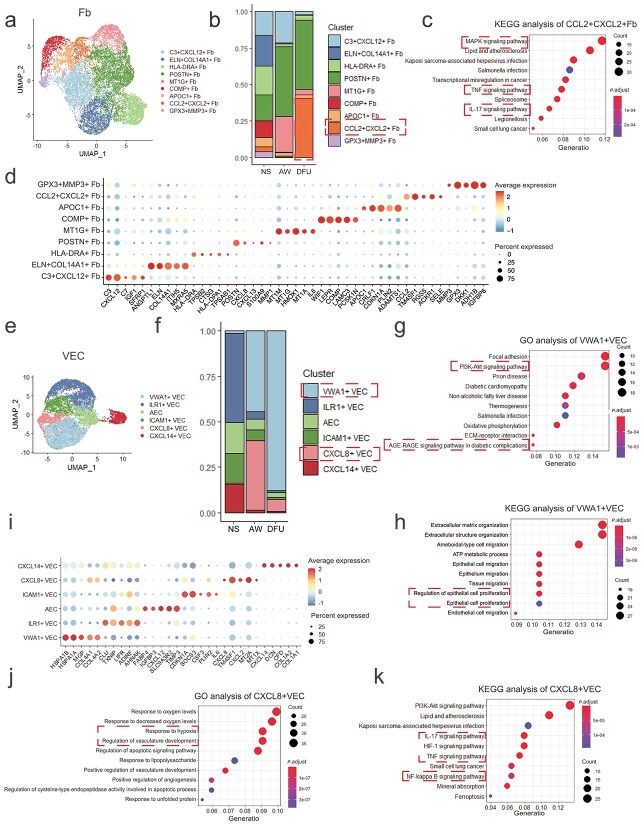
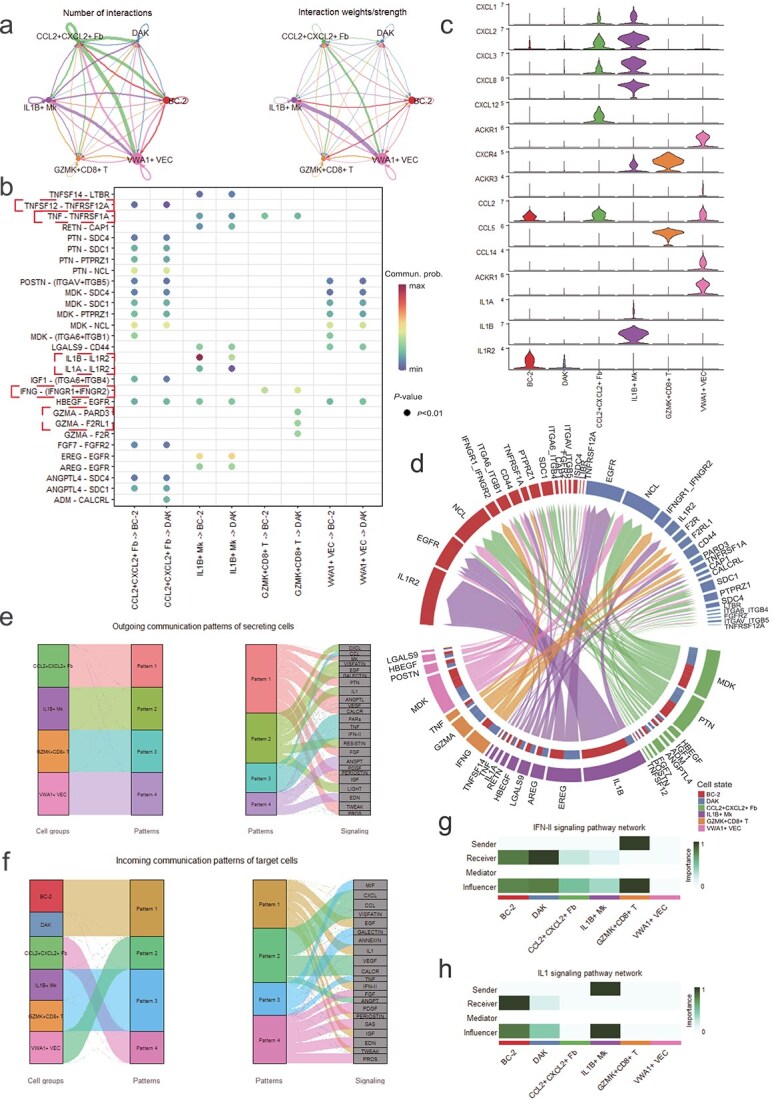
Results: Our research provided a comprehensive map of the phenotypic and dynamic changes that occur during epidermal differentiation, alongside the corresponding regulatory networks in DFU. Importantly, we identified two subtypes of keratinocytes: basal cells (BC-2) and diabetes-associated keratinocytes (DAK) that might play crucial roles in the impairment of epidermal homeostasis. BC-2 and DAK showed a marked increase in DFU, with an inactive state and insufficient motivation for epidermal differentiation. BC-2 was involved in the cellular response and apoptosis processes, with high expression of TXNIP, IFITM1, and IL1R2. Additionally, the pro-differentiation transcription factors were downregulated in BC-2 in DFU, indicating that the differentiation process might be inhibited in BC-2 in DFU. DAK was associated with cellular glucose homeostasis. Furthermore, increased CCL2 + CXCL2+ fibroblasts, VWA1+ vascular endothelial cells, and GZMA+CD8+ T cells were detected in DFU. These changes in the wound microenvironment could regulate the fate of epidermal cells through the TNFSF12-TNFRSF12A, IFNG-IFNGR1/2, and IL-1B-IL1R2 pathways, which might result in persistent inflammation and impaired epidermal differentiation in DFU.

Conclusions: Our findings offer novel insights into the pathophysiology of DFU and present potential therapeutic targets that could improve wound care and treatment outcomes for DFU patients.

Keywords: Diabetic foot ulcer; Epidermal homeostasis; Re-epithelization; Single-cell RNA sequencing; Wound microenvironment.


Conflict of interest statement

The authors declare that they have no competing interests.

Figures

Graphical Abstract
Graphical Abstract
Figure 1
Figure 1
Atlas of various cell types in NS, AW, and DFU tissues at the single-cell level. (a) Workflow for scRNA-seq and LCM-seq. (b) Clusters and manual annotations of 98 038 cells obtained from NS, AW, and DFU tissues. (c) Heatmap of the marker genes in each cluster. Two representative genes are displayed on the left. The color key from purple to yellow indicates low to high levels of gene expression. (d) Stacked bar plot of the proportions in each cluster. (e) Violin plots and feature plots of marker genes (LY6D, FBLN1, ACKR1, CCL5, and LYZ) that are significantly expressed in KC, Fb, VEC, T cells, and MYC, respectively. (f) HE staining of NS, AW, and DFU tissues. The brackets indicate the thickness of the epidermis and the wound edges are visible. The arrows highlight the parakeratosis in the stratum corneum at a higher magnification. The black scale bar represents 100 μm, and the magnification is 200X. The red scale bar represents 50 μm, and the magnification is 400X. (g) Statistical analysis of epidermal thickness; n = 3 for each group. The data represent the mean ± SD. *p <0.05, **p <0.01. Normal skin (NS), acute wound (AW), diabetic foot ulcer (DFU), laser-capture microscopy (LCM), fibroblasts (Fb), keratinocytes (KC), smooth muscle cells (SMC), T lymphocytes (T cells), vascular endothelial cells (VEC), myeloid cells (MYC), mast cells (mast), lymphatic endothelial cells (LEC), sebaceous gland cells (SGC), B lymphocytes (B cells), proliferative cells (PC), neuronal cells (NC), and melanocytes (MEL)
Figure 2
Figure 2
Subtypes of keratinocytes in NS, AW, and DFU tissues. (a) UMAP plot of keratinocytes. Keratinocytes are categorized by their respective types and annotated to the right. (b) Dot plot of marker genes highly expressed in each KC cluster. (c) Stacked bar plot of the proportions in each cluster. (d) Heatmap of the marker genes (red) in each basal cell cluster (BC-1, BC-2, BC-3, BC-4, and DAK). The selected marker genes and related biological functions for each cluster are displayed on the right. (e) mIHC analysis of IL1R2 (red), TXNIP (purple), KRT15 (green), and DAPI (blue) in each group of samples. Positive cells are labeled with arrows. The yellow scale bar represents 50 μm, and the magnification was 200X. The white scale bar represents 20 μm, and the magnification was 400X. (f) Quantitative analysis of IL1R2 + TXNIP+ cells. n = 3 for each group. The data represent the mean ± SD. **p <0.01, (ns) p >0.05. (g) mIHC analysis of SH3KBP1 (red), GRP (purple), KRT15 (green), and DAPI (blue) in each group of samples. Positive cells are labeled with arrows. The yellow scale bar represents 50 μm, and the magnification was 200X. The white scale bar represents 20 μm and the magnification was 400X. (h) Quantitative analysis of SH3KBP1 + GRP+ cells. n = 3 for each group. The data represent the mean ± SD. *p <0.05, (ns) p >0.05. Basal cells (BC), diabetes-associated keratinocytes (DAK), spinous cells (SC), granular cells (GC), hair follicle cells (HFC), and intermediate keratinocytes (inter-KC)
Figure 3
Figure 3
The biological function and potential regulatory mechanisms of BC-2 and DAK. (a) Dot plot of the marker genes of BC-2. (b) Dot plot of the marker genes of DAK. (c) GSVA analysis of the subtypes of KC. The related pathways of BC-2 and DAK are highlighted in the red box. (d) GSVA analysis of the subtypes of KC in the IFN-α and IFN-γ pathways. (e) GO analysis for biological processes enriched in BC-2. (f) GO analysis for biological processes enriched in DAK. (g) Heatmap of TFs in BC-2 in each group. (h) Heatmap of TFs in DAK in each group. The color key from blue to red indicates low to high levels of TF expression.Interferon-alpha (IFN-α), interferon-gamma (IFN-γ), gene ontology (GO), transcription factors (TFs), basal cells (BC), and diabetes-associated keratinocytes (DAK)
Figure 4
Figure 4
Pseudo-time analysis of KC and impaired epidermal differentiation in DFU. (a) Pseudo-temporal cells ordering of the total KC along the differentiation trajectory. (b) Pseudo-temporal cell ordering of KC in AW along the differentiation trajectory. (c) Pseudo-temporal cell ordering of the KC in the DFU along the differentiation trajectory. The pseudo-time data are depicted in dark purple to light yellow (d) The expression levels of the marker genes COL17A1, KRT14, FOS, IFITM1, S100A7, KRT6C, KRT1, and KRT10 along the pseudo-time trajectory. (e) UMAP analysis of the cell cycle distribution of KC at different stages. The cells are colored by type and annotated in the graph. (f) S score of each KC cluster. (g) G2M. Score of each KC cluster. *p-value <0.05. (h) Gene scoring analysis of the molecular signatures, including the Q score, diff score and inflammatory score. *p <0.05, **pe <0.01, (ns) p >0.05. (i) Schematic of epidermal cell differentiation trajectories in AW and DFU. Quiescent score (Q score), differentiated score (diff score), basal cells (BC), diabetes-associated keratinocytes (DAK), and differentiated keratinocytes (diff-KC)
Figure 5
Figure 5
The heterogeneity of fb and VEC in NS, AW, and DFU. (a) UMAP plot of Fb. The cells were colored according to orthogonally generated clusters and labeled by manual cell type annotation. (b) Stacked bar plot of the proportions of subclusters of Fb in each group. CCL2 + CXCL2+ Fb is highlighted with a red box. (c) KEGG analysis of CCL2 + CXCL2+ Fb. The count indicates the number of genes and the color key from blue to red indicates the range of P-values. (d) Dot plot of the marker genes in each Fb cluster. The color key from blue to yellow indicates the average expression of genes. The node size is positively associated with the proportion of cells expressing specific markers. (e) UMAP plot of VEC. (f) Stacked bar plot of the proportions of VEC subclusters in each group. VWA1+ VEC and CXCL8+ VEC are highlighted with red boxes. (g) GO analysis of VWA1+ VEC. (h) KEGG analysis of VWA1+ VEC. (i) Dot plot of marker genes highly expressed in each VEC cluster. (j) GO analysis of CXCL8+ VEC. (k) KEGG analysis of CXCL8+ VEC. Fibroblasts (fb), vascular endothelial cells (VEC), gene ontology (GO), and Kyoto Encyclopedia of genes and genomes (KEGG)
Figure 6
Figure 6
CCI analysis between the proinflammatory microenvironment and key KC subpopulations (BC-2 and DAK) in DFU, (a) the number and strength of potential ligand–receptor pairs between different clusters. (b) Dot plot of the potential ligand–receptor interactions between ligand-expressing cells and receptor-expressing cells. The color key from green to red indicates the probability of communication. (c) Violin plots of selected genes in ligand cells and receptor cells. (d) Circle graph of potential ligand–receptor interactions between ligand-expressing cells and receptor-expressing cells. (e) Outgoing communication patterns of secreting cells. (f) Incoming communication patterns of target cells. (g) IFN-II signaling pathway network in selected cells. (h) IL-1 signaling pathway network in selected cells

Similar articles

Cited by

References

    1. Cho NH, Shaw JE, Karuranga S, Huang Y, Da Rocha FJD, Ohlrogge AW, et al. IDF diabetes atlas: global estimates of diabetes prevalence for 2017 and projections for 2045. Diabetes Res Clin Pract. 2018;138:271–81. 10.1016/j.diabres.2018.02.023. - DOI - PubMed
    1. Armstrong DG, Boulton AJM, Bus SA. Diabetic foot ulcers and their recurrence. N Engl J Med. 2017;376:2367–75. 10.1056/NEJMra1615439. - DOI - PubMed
    1. Everett E, Mathioudakis N. Update on management of diabetic foot ulcers. Ann N Y Acad Sci. 2018;1411:153–65. 10.1111/nyas.13569. - DOI - PMC - PubMed
    1. Hart T, Milner R, Cifu A. Management of a Diabetic Foot. JAMA. 2017;318:1387–8. 10.1001/jama.2017.11700. - DOI - PubMed
    1. Liu Y, Shi Y, Zhu J, Chen X, Yang R, Shu B, et al. Study on the effect of the five-in-one comprehensive limb salvage Technologies of Treating Severe Diabetic Foot. Adv Wound Care (New Rochelle). 2020;9:676–85. 10.1089/wound.2018.0903. - DOI - PMC - PubMed