. 2025 Feb 18:16:1526648.
doi: 10.3389/fpls.2025.1526648. eCollection 2025.

Nitrogen and phosphorus fertilizer use efficiency improves alfalfa (Medicago sativa L.) production and performance in alkaline desert soil

Affiliations

Nitrogen and phosphorus fertilizer use efficiency improves alfalfa (Medicago sativa L.) production and performance in alkaline desert soil

Yanliang Sun et al. Front Plant Sci. .

Abstract

The deficiency of nitrogen and phosphorus is a primary constraint on the normal growth of alfalfa (Medicago Sativa L.) in the alkaline desert soils of northern Xinjiang. Optimizing the combination of nitrogen and phosphorus fertilizers can maximally significantly enhance farmers' economic returns while concurrently mitigate soil environmental pollution. For this purpose, a field experiment based on a randomized complete block design was conducted over two consecutive years (2019 and 2020) in Shihezi, Xinjiang province, China. The WL366HQ variety of alfalfa was evaluated with four levels each of urea and monoammonium phosphate. The effects of fertilizer treatments were assessed on alfalfa yield, growth traits, nutritional quality, fertilizer use efficiency, and economic benefit. Application of nitrogen (N), phosphorus (P), and their interaction significantly (P< 0.05) affected cumulative alfalfa dry matter (DM) yield. In general, compared to no-fertilization treatment, the application of N and P fertilizers resulted in increased plant height, stem thickness, crude protein, and ether extract of alfalfa, while neutral detergent fiber (NDF) and acid detergent fiber (ADF) exhibited a decreasing trend. Additionally, while N and P fertilizer application reduced corresponding fertilizer use efficiency, it increased non-corresponding fertilizer use efficiency. During the two-year experimental period, the treatment involving the application of urea at 286.3 kg·ha-1 combined with monoammonium phosphate at 192 kg·ha-1 achieved the highest evaluation scores for production performance, fertilizer use efficiency, and total net profit, resulting in a net profit increase of 44.18% compared to the no-fertilizer treatment. These findings lay the groundwork for nuanced fertilization strategies in future alfalfa cultivation.

Keywords: agronomic efficiency; best management practices (BMPs); environmental concerns; rational and economical fertilization; yield enhancement.


Conflict of interest statement

The authors declare that the research was conducted in the absence of any commercial or financial relationships that could be construed as a potential conflict of interest.

Figures

Figure 1
Figure 1
Daily precipitation, maximum and minimum temperatures during the experimental period in 2019 and 2020.
Figure 2
Figure 2
Effect of nitrogen (N) and phosphorus (P) treatments on the cumulative yield of alfalfa at different cuts (harvests) in 2019 (A) and 2020 (B). Data are presented as the mean ± SD (n = 3). The previous error bars and letters are the standard deviation and multiple comparison results of each cut of alfalfa yield, and the last column of error bars and letters are the standard deviation and multiple comparison results of the annual cumulative yield. Different capital letters indicate significant (P< 0.05) differences between different N fertilizer levels under the same P application condition (Different small letters indicate significant (P< 0.05) differences between different P fertilizer treatments under the same N application condition. FN, FP and FN × FP represent the F value under the N application levels, P application levels and the interaction of N and P application levels, respectively. ** indicates extremely significant (P< 0.01) difference.
Figure 3
Figure 3
Effect of nitrogen (N) and phosphorus (P) treatments on the plant height of alfalfa at different cuts in 2019 (A, B) and 2020 (C, D). Data are presented as the mean ± SD (n = 3). Different capital letters indicate significant (P< 0.05) differences between different N fertilizer levels under the same P application condition. Different small letters indicate significant (P< 0.05) differences between different P fertilizer treatments under the same N application condition. * indicates significant (P< 0.05) difference.
Figure 4
Figure 4
Effect of nitrogen (N) and phosphorus (P) treatments on stem thick of alfalfa at different cuts in 2019 (A, B) and 2020 (C, D). Different capital letters indicate significant (P< 0.05) differences between different N fertilizer levels under the same P application. Different small letters indicate significant (P< 0.05) differences between different P fertilizer treatments under the same N application. * indicates significant (P< 0.05) difference.
Figure 5
Figure 5
Effect of nitrogen (N) and phosphorus (P) treatments on the crude protein (CP) of alfalfa at different cuts in 2019 (A, B) and 2020 (C, D). Different capital letters indicate significant (P< 0.05) differences between different N fertilizer levels under the same P application condition. Different small letters indicate significant (P< 0.05) differences between different P fertilizer treatments under the same N application condition. * indicates significant (P< 0.05) difference.
Figure 6
Figure 6
Effect of nitrogen (N) and phosphorus (P) treatments on the neutral detergent fiber (NDF) of alfalfa at different cuts in 2019 (A, B) and 2020 (C, D). Different capital letters indicate significant (P< 0.05) differences between different N fertilizer levels under the same P application condition. Different small letters indicate significant (P< 0.05) differences between different P fertilizer treatments under the same N application condition. * indicates significant (P< 0.05) difference.
Figure 7
Figure 7
Effect of nitrogen (N) and phosphorus (P) treatments on the acid detergent fiber (ADF) of alfalfa at different cuts in 2019 (A, B) and 2020 (C, D). Different capital letters indicate significant (P< 0.05) differences between different N fertilizer levels under the same P application condition. Different small letters indicate significant (P< 0.05) differences between different P fertilizer treatments under the same N application condition. * indicates significant (P< 0.05) difference.
Figure 8
Figure 8
Effect of nitrogen (N) and phosphorus (P) treatments on the ether extract (EE) of alfalfa at different cuts in 2019 (A, B) and 2020 (C, D). Different capital letters indicate significant (P< 0.05) differences between different N fertilizer levels under the same P application condition. Different small letters indicate significant (P< 0.05) differences between different P fertilizer treatments under the same N application condition. * indicates significant (P< 0.05) difference.
Figure 9
Figure 9
Correlation matrix between dry matter yield (DM), growth traits, and nutritional quality of alfalfa. The bottom left lines are least-squares fits and the shaded areas are the 95% CI regions, and the top right is the Pearson correlation coefficient. * indicates significant difference at P< 0.05 and ** indicates extremely significant difference at P< 0.01.
Figure 10
Figure 10
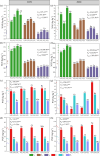
Fertilizer agronomic use efficiency and fertilizer uptake efficiency of alfalfa under different fertilization treatments in 2019 (A–D) and 2020 (E–H). NAE: nitrogen (N) agronomic use efficiency; NUE: N uptake efficiency; PAE: phosphorus (P) agronomic use efficiency; and PUE: P uptake efficiency. Data are presented as the mean ± SD (n = 3). Different capital letters indicate significant (P< 0.05) differences between different N fertilizer levels under the same P application condition. Different small letters indicate significant (P< 0.05) differences between different P fertilizer treatments under the same N application condition (P< 0.05). FN, FP and FN × FP represent the F value under the N application levels, P application levels and the interaction of N and P application levels, respectively. ns indicates no significant (P > 0.05) difference and ** indicates significant (P > 0.01) difference.
Figure 11
Figure 11
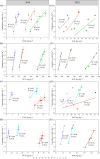
Regression relationship between cumulative yield and nitrogen (N) agronomic use efficiency (A, E), N uptake efficiency (B, F), phosphorus (P) agronomic use efficiency (C, G), and P uptake efficiency (D, H) in 2019 and 2020. NAE, N agronomic use efficiency; NUE, N uptake efficiency; PAE, P agronomic use efficiency; PUE, P uptake efficiency.
Figure 12
Figure 12
Principal component analysis score map [(A, B) in 2019; (C, D) in 2020], load map [(E, F) in 2019; (G, H) in 2020] and comprehensive evaluation [(I) in 2019; (J) in 2020] of DM yield, growth traits, nutritional quality, and fertilizer use efficiency of alfalfa under different fertilization treatments.

References

    1. Anas M., Liao F., Verma K. K., Sarwar M. A., Mahmood A., Chen Z.-L., et al. . (2020). Fate of nitrogen in agriculture and environment: agronomic, eco-physiological and molecular approaches to improve nitrogen use efficiency. Biol. Res. 53, 47. doi: 10.1186/s40659-020-00312-4 - DOI - PMC - PubMed
    1. AOAC (2005). “Official methods of analysis of the association of official analytical international,” in Method 989.05, 18th ed. Ed. Horwitz W. (AOAC International, Arlington, USA: ).
    1. Bastos L. M., Carciochi W., Lollato R. P., Jaenisch B. R., Rezende C. R., Schwalbert R., et al. . (2020). Winter wheat yield response to plant density as a function of yield environment and tillering potential: A review and field studies. Front. Plant Sci. 11. doi: 10.3389/fpls.2020.00054 - DOI - PMC - PubMed
    1. Bhandari K. B., West C. P., Acosta-Martinez V. (2020). Assessing the role of interseeding alfalfa into grass on improving pasture soil health in semi-arid Texas High Plains. Appl. Soil Ecol. 147, 103399. doi: 10.1016/j.apsoil.2019.103399 - DOI
    1. Chtouki M., Laaziz F., Naciri R., Garré S., Nguyen F., Oukarroum A. (2022). Interactive effect of soil moisture content and phosphorus fertilizer form on chickpea growth, photosynthesis, and nutrient uptake. Sci. Rep. 12, 6671. doi: 10.1038/s41598-022-10703-0 - DOI - PMC - PubMed

LinkOut - more resources