. 2025 Feb 18:15:1511900.
doi: 10.3389/fcimb.2025.1511900. eCollection 2025.

Multiomics insights into BMI-related intratumoral microbiota in gastric cancer

Affiliations

Multiomics insights into BMI-related intratumoral microbiota in gastric cancer

Kang Liu et al. Front Cell Infect Microbiol. .

Abstract

Introduction: Body mass index (BMI) is considered an important factor in tumor prognosis, but its role in gastric cancer (GC) remains controversial. There is a lack of studies exploring the effect of BMI on gastric cancer from the perspective of intratumoral microbiota. This study aimed to compare and analyze the differences in and functions of intratumoral microbiota among GC patients with varying BMIs, aiming to ascertain whether specific microbial features are associated with prognosis in low-BMI (LBMI) gastric cancer patients.

Methods: A retrospective analysis of the clinicopathological features and prognosis of 5567 patients with different BMIs was performed between January 2010 and December 2019. Tumor tissues from 189 GC patients were collected for 16S rRNA sequencing, 64 samples were selected for transcriptome sequencing, and 57 samples were selected for untargeted metabolomic analysis.

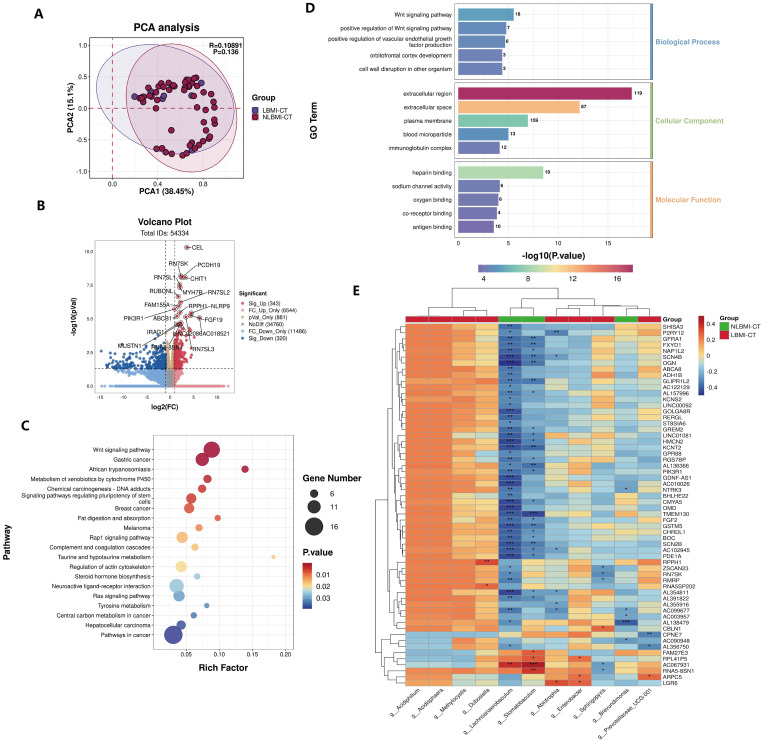
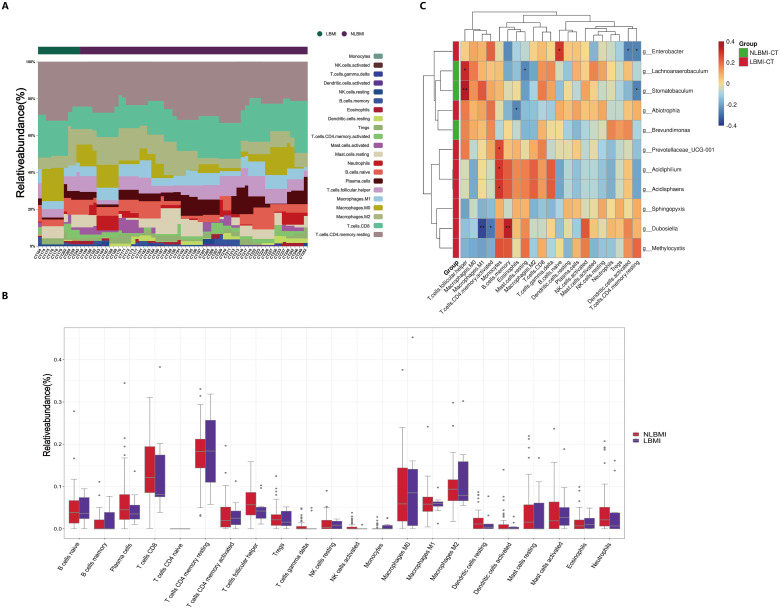
Results: Clinical cohort analysis revealed that GC patients with a low BMI presented poorer clinical and pathological characteristics than those with a non-low-BMI (NLBMI). LBMI was identified as a significant independent risk factor for adverse prognosis, potentially exerting immunosuppressive effects on postoperative adjuvant chemotherapy. 16S rRNA sequencing revealed no significant differences in the alpha and beta diversity of the intratumoral microbiota between the two groups of GC patients. However, LEfSe analysis revealed 32 differential intratumoral microbiota between the LBMI and NLBMI groups. Notably, the genus Abiotrophia was significantly enriched in the LBMI group. Further in-depth analysis indicated that the genus Abiotrophia was inversely associated with eosinophils, P2RY12, and SCN4B genes, and positively linked with LGR6 in LBMI gastric cancer patients. Metabolomic assessments revealed that LBMI was positively associated with purine metabolites, specifically guanine and inosine diphosphate (IDP).

Discussion: In conclusion, LBMI is an independent risk factor for poor prognosis in gastric cancer patients and may have an inhibitory effect on postoperative adjuvant chemotherapy. Intratumor flora of gastric cancer patients with different BMI levels differed, with different immune cell infiltration and metabolic characteristics. The genus Abiotrophia may promote gastric cancer development and progression by regulating eosinophils and the purine metabolism pathway, which provides a new idea for the precise treatment of gastric cancer.

Keywords: BMI; GC; immune cells; intratumoral microbiota; metabolome.


Conflict of interest statement

The authors declare that the research was conducted in the absence of any commercial or financial relationships that could be construed as a potential conflict of interest.

Figures

Figure 1
Figure 1
LBMI is an independent risk factor for poor prognosis in GC. (A) Clinical cohort screening flowchart. Kaplan-Meier survival curve analysis for different cohorts classified by BMI. (B) All patients. (C) All matched patients. (D) Stage I (E) Stage II. (F) Stage III. (G) Stage IV. (H) PAT. (I) PAT of PSM. BMI, Body Mass Index. ELNs, Number of dissected lymph nodes. PSM, Propensity Score Matching. PAT, Postoperative Adjuvant Therapy. LBMI, Low Body Mass Index (BMI < 18.5). NLBMI, Non-Low Body Mass Index (BMI ≥ 18.5).All P values for survival curves were corrected for multiplicity by the BH method.
Figure 2
Figure 2
Tumor microbiome landscape of LBMI and NLBMI gastric cancer patients. Alpha diversity analysis of the LBMI and NLBMI groups. (A) Shannon index and (B) Simpson index in gastric cancer samples of each group. (C) Beta diversity analysis using UniFrac distance-weighted PCoA shows differences between cancerous and adjacent tissues in low BMI and non-low BMI groups. (D) PLS-DA analysis shows that the tumor microbiome composition of GC patients in the LBMI group and NLBMI group can be clearly divided into two different clusters. Stacked bar charts showing the species composition at (E) phylum level and (F) genus level for LBMI and NLBMI groups. LBMI-CT, Low BMI tumor tissue; LBMI-NT, Low BMI adjacent normal tissue; NLBMI-CT, Non-Low BMI tumor tissue; NLBMI-NT, Non-Low BMI adjacent normal tissue. PLS-DA, Partial Least Squares Discriminant Analysis. PCoA, Principal Coordinate Analysis. P < 0.05 is considered statistically significant. no * indicates P value ≥ 0.05, * indicates 0.01 ≤ P < 0.05, ** indicates 0.001 ≤ P < 0.01, *** indicates P < 0.001. ns, No sense.
Figure 3
Figure 3
Significantly increased intratumoral g_Abiotrophia in LBMI. (A) Lefse analysis of LBM-CT and NLBMI-CT groups. The criterion for feature selection is an LDA score >2.0. The color of the bars represents the group, and the length of the bars represents the size of the LDA score. LDA score indicates the influence of the microbiota on LBMI and NLBMI groups. (B-J) Box plots of differential genus-level dominant bacteria abundance in GC patients between LBMI and NLBMI groups. P < 0.05 is considered statistically significant. The “*” in the figure indicates the significance level: no * indicates P value ≥ 0.05, * indicates 0.01 ≤ P < 0.05, ** indicates 0.001 ≤ P < 0.01, *** indicates P < 0.001. ns, No sense. LBMI-CT, Low BMI tumor tissue; NLBMI-CT, Non-Low BMI tumor tissue.
Figure 4
Figure 4
Negative correlation between intratumoral g_Abiotrophia and P2RY12 in LBMI. (A) Principal Component Analysis (PCA) of transcriptome samples from GC patients in the LBM-CT and NLBMI-CT groups. (B) Volcano plot of GC patients in the LBM-CT and NLBMI-CT groups, with selection criteria (|log2FC| ≥ 1, P < 0.05). (C, D) The function of these genes and transcription pathways was investigated using the KEGG and GO databases, and the TOP20 KEGG pathways were displayed in a bubble chart and the TOP15 GO pathways were shown in a bar chart. (E) Correlation heatmap showing the spearman analysis of the TOP60 differential genes and genus-level intratumoral bacteria. Red indicates positive correlation; blue indicates negative correlation. The color depth represents the magnitude of the correlation coefficient, with color ranging from light to dark indicating increasing correlation value. P < 0.05 is considered statistically significant. The “*” in the figure indicates the significance level: no * indicates P value ≥ 0.05, * indicates 0.01 ≤ P < 0.05, ** indicates 0.001 ≤ P < 0.01, *** indicates P < 0.001. LBMI-CT, Low BMI tumor tissue; NLBMI-CT, Non-Low BMI tumor tissue.
Figure 5
Figure 5
Negative correlation between intratumoral g_Abiotrophia and eosinophils in LBMI. (A) Bar chart of the relative abundance of 22 immune cells in GC patients grouped by BMI status. Each bar represents a sample, with each color corresponding to a different immune cell type. The y-axis represents the relative abundance values of the immune cells, with the sum of the relative abundance of all immune cells in a single sample equal to 1. (B) Box plot showing differences in the abundance of tumor-infiltrating immune cells between LBMI and NLBMI groups. (C) Correlation heatmap showing spearman analysis between tumor-infiltrating immune cells and genus-level intratumoral bacteria. The x-axis represents immune cells, and the y-axis represents bacteria. Red indicates positive correlation; blue indicates negative correlation. The color depth represents the magnitude of the spearman correlation coefficient, with color ranging from light to dark indicating increasing correlation value. The “*” in the figure indicates the significance level: no * indicates P value ≥ 0.05, * indicates 0.01 ≤ P < 0.05, ** indicates 0.001 ≤ P < 0.01, *** indicates P < 0.001. LBMI-CT, Low BMI tumor tissue; NLBMI-CT, Non-Low BMI tumor tissue.
Figure 6
Figure 6
Increased purine metabolism in LBMI intratumoral environment. (A) Volcano plot of GC patients’ tumor tissues comparing LBM-CT and NLBMI-CT groups, with screening criteria (|log2FC|≥1, P < 0.05). (B) PLS-DA analysis of differential metabolites between LBM-CT and NLBMI-CT groups, with screening criteria (VIP>1, |log2FC|≥1, P < 0.05). (C) Validation of the PLS-DA model indicating that the model established in this study is effective. (D) Bar chart of enriched pathways using the KEGG database to investigate the functions of these metabolites and metabolic pathways. (E) Correlation heatmap showing spearman analysis between differential metabolites and genus-level intratumoral bacteria. Red indicates positive correlation; blue indicates negative correlation. The color depth represents the magnitude of the correlation coefficient, with color ranging from light to dark indicating increasing correlation value. The “*” in the figure indicates the significance level: no * indicates P value ≥ 0.05, * indicates 0.01 ≤ P < 0.05, ** indicates 0.001 ≤ P < 0.01, *** indicates P < 0.001. LBMI-CT, Low BMI tumor tissue; NLBMI-CT, Non-Low BMI tumor tissue.

References

    1. Ahn H. S., Lee H. J., Yoo M. W., Jeong S. H., Park D. J., Kim H. H., et al. . (2011). Changes in clinicopathological features and survival after gastrectomy for gastric cancer over a 20-year period. Br. J. Surg. 98, 255–260. doi: 10.1002/bjs.7310 - DOI - PubMed
    1. Amin M. B., Greene F. L., Edge S. B., Compton C. C., Gershenwald J. E., Brookland R. K., et al. . (2017). The Eighth Edition AJCC Cancer Staging Manual: Continuing to build a bridge from a population-based to a more “personalized” approach to cancer staging. CA: A Cancer J. Clin. 67, 93–99. doi: 10.3322/caac.21388 - DOI - PubMed
    1. Association JGC (2020). Japanese gastric cancer treatment guidelines 2018 (5th edition). Gastric Cancer. 24, 1–21. - PMC - PubMed
    1. Ben Addi A., Cammarata D., Conley P. B., Boeynaems J.-M., Robaye B. (2010). Role of the P2Y12 receptor in the modulation of murine dendritic cell function by ADP. J. Immunol. 185, 5900–5906. doi: 10.4049/jimmunol.0901799 - DOI - PubMed
    1. Borea P. A., Gessi S., Merighi S., Vincenzi F., Varani K. (2018). Pharmacology of adenosine receptors: the state of the art. Physiol. Rev. 98, 1591–1625. doi: 10.1152/physrev.00049.2017 - DOI - PubMed

Substances

LinkOut - more resources