. 2025 Mar 3;14(3):e70026.
doi: 10.1002/cti2.70026. eCollection 2025.

Decreased levels and function of dendritic cells in blood and airways predict COVID-19 severity

Affiliations

Decreased levels and function of dendritic cells in blood and airways predict COVID-19 severity

Björn Österberg et al. Clin Transl Immunology. .

Abstract

Objectives: Monocytes and dendritic cells (DCs) are essential players in the immune response to infections, involved in shaping innate and adaptive immunity. However, a complete understanding of their specific roles in respiratory infections, including SARS-CoV-2, remains elusive.

Methods: To investigate the dynamics of monocytes and DCs in blood as well as the upper and lower airways, we sampled 147 patients with varying degree of COVID-19 severity longitudinally during the spring of 2020.

Results: Using flow cytometry, proteomics and in vitro TLR stimulation, we found differences in the distribution and function of monocytes and DCs in patients compared with controls, and importantly, reduced levels of DCs in both blood and airways. In fact, lower frequencies of cDC2s (Lin- HLA-DR+ CD1c+) early after symptom onset predicted subsequent severe disease, and depletion of DC subsets lasted longer in patients with more severe disease. In contrast, severe COVID-19 was associated with increased frequencies of activated monocytes in the lower, but not the upper, airways. Proteomic analysis showed that monocyte and DC-related cytokines in plasma and airways associated with disease severity. During convalescence, cell frequencies and responses to TLR ligands normalised in blood, except for persistently low plasmacytoid DCs.

Conclusion: Our study reveals a distinct pattern of recruitment of monocytes but not DCs to the airways during severe COVID-19. Instead, decreased levels of DCs in both blood and airways were found, possibly contributing to more severe COVID-19. The connection between low blood DCs early in disease course and more severe outcomes provides insight into COVID-19 immunopathology, with possible therapeutic implications.

Keywords: COVID‐19; SARS‐CoV‐2; dendritic cells; monocytes; respiratory immunology.


Conflict of interest statement

AS‐S is a paid consultant to Astra‐Zeneca on COVID‐19 clinical trials not related to this study.

Figures

Figure 1
Figure 1
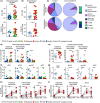
Study outline and clinical characteristics of patients. (a) Blood and nasopharyngeal aspirates (NPA) were collected from COVID‐19 patients and healthy controls (HC). Endotracheal aspirates (ETA) were collected from ICU patients and intubated controls. (b) Patients were sampled longitudinally including at 3 and 8 months from symptom onset. (c) PCR Cycle threshold values (Ct values) indicating viral RNA load at time of diagnosis. Patients colour‐coded by peak severity: mild n = 17, moderate n = 50, severe n = 57, fatal n = 12. (d) Representative gating strategy to identify monocyte and dendritic cell (DC) subsets by flow cytometry (blood). From live, single CD45+ leukocytes, lineage negative (CD3CD19CD20CD56CD66abce), HLA‐DR+ cells were identified. cDC1, conventional DC1; cDC2, conventional DC2; CM, classical monocyte; IM, intermediate monocyte; moDC, monocyte‐derived DC; NCM, non‐classical monocyte; pDC = plasmacytoid DC. (e, f) Monocytes and DCs in blood from COVID‐19 patients and healthy controls (HC). Frequencies in COVID‐19 patients (colour‐coded by peak severity) and HC per lin‐HLA‐DR+ cells in blood at first time point across disease severity: (e) monocyte subsets and (f) DC subsets. HC: blood n = 12. COVID‐19 patients: n = 140. (g) Heatmaps showing relative geometric mean fluorescence intensity (MFI) of HLA‐DR, CD86, CCR2 and CD62L on blood monocyte and DCs: HC, n = 17; mild COVID‐19, n = 15; moderate COVID‐19, n = 5; severe COVID‐19, n = 43; fatal COVID‐19, n = 7. Comparisons were performed using the nonparametric Kruskal–Wallis test and subsequent Dunn's post hoc test of multiple comparisons. Stars (*) indicate significant differences compared to HC, hashtags (#) indicate significant differences compared to mild patients and diamonds (⋄) indicate significant differences compared to moderate patients.
Figure 2
Figure 2
Temporal changes in blood monocytes and DCs across COVID‐19 severity. (a–g) Frequency of monocyte and DC subsets per lineage‐HLA‐DR+ cells in blood, across disease severity and over time (days since onset), showing median and IQR for mild–moderate patients and severe‐fatal patients respectively. HC: blood n = 17. Mild/moderate: n = 104 samples from 72 patients. Severe/Fatal n = 132 samples from 69 patients. (h) Frequency of blood pDCs at 3 and 8 months compared to HC. Groups were compared using Mann–Whitney U‐tests with a Bonferroni correction. Stars (*) indicate significant differences between the severity groups. (i) Result from Poisson regression model of the role of %cDC2 (of lineage‐HLA‐DR+ cells) in blood on the risk of severe or fatal disease. Samples from the first 14 days after symptom onset were used, and the first sample was used in case multiple samples were available from a participant. A total of 60 samples were used for the analysis.
Figure 3
Figure 3
Cell composition and expression of HLA‐DR and CD86 in nasopharyngeal aspirates (NPA) and endotracheal aspirates (ETA). (a, b) Total counts of live cells and lineage‐HLA‐DR+ cells in (a) NPA live cells(patients n = 20, controls n = 8), lineage‐HLA‐DR+ cells (patients n = 21, controls n = 15) and (b) ETA (patients n = 21, controls n = 8). (c) Proportions of granulocytes, T cells, B cells, NK cells, CD14+ monocytes and other lineage‐ (CD3CD19CD56CD66) HLA‐DR+ cells out of live, CD45+ cells in COVID‐19 patients and controls. ETA: patients n = 20, controls n = 4. NPA patients n = 13, controls = 5. (d, f) Frequencies of (d) monocyte and (f) DC subsets in NPA from patients (n = 23) with between 3 and 55 days of symptoms and controls (n = 15). (e, g) Frequencies of (e) monocyte and (g) DC subsets in ETA from patients (n = 23) and controls (n = 8). (h, i) Expression level (MFI values × 104) of HLA‐DR and CD86 in paired samples (same timepoint and same patient). COVID‐19 patients (n = 9) and controls [ETA (n = 8) and NPA (n = 16)]. (a, b, d–i) COVID‐19 patients colour‐coded by peak severity, healthy controls (closed circles), intubated controls (open circles). Comparisons of frequencies were performed using the Mann–Whitney U‐test. In strip charts, group medians are presented as horizontal lines and individual patients as jitter points. For patients with several samples, the first sample was included. Stars (*) indicate significant differences between groups. Comparisons of expression levels were performed using the Wilcoxon signed‐rank test with Bonferroni correction.
Figure 4
Figure 4
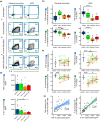
Stimulation of PBMCs from COVID‐19 patients and healthy controls (HC). (a) Representative plots showing classical monocytes (CMs) and cDC2s after incubation in the unstimulated condition (i), in the presence of stimulant (ii–iv), (ii) PBMCs from a patient during acute illness and (iii) after 8 months; (iv) from a HC. (b) Boxplots showing % of CMs or cDC2s from COVID‐19 patients with between 3 and 25 days of symptoms responding to stimulation with either TNF or IL‐6. HC, n = 15; Mild, n = 6; Moderate, n = 7; Severe, n = 5. (c) Dotplots (black bar respresents median) showing % of CMs and cDC2s responding to R848 stimulation during acute illness and convalescence. HC, n = 15; Acute, n = 18; 3 month, n = 13; 8 month, n = 16. Colours show peak COVID‐19 severity. (d) Barplots showing median levels of TNF and IL‐6 (Luminex) in supernatants from stimulated samples from acute illness and one convalescent timepoint (conv.). Black bars: unstimulated samples, coloured bars: stimulated samples. Each point represents one sample, open rings: unstimulated samples, closed rings: stimulated samples. HC, n = 14; Mild Acute, n = 6; Mild Conv., n = 6; Moderate Acute, n = 7; Moderate Conv., n = 6; Severe Acute, n = 5; Severe Conv., n = 5. (e) Scatterplot showing correlation between TNF and IL‐6 levels (Luminex) in supernatants and CMs producing the corresponding cytokine (% of lineage‐ HLA‐DR+ cells). The correlation analysis was performed using Spearman's rho.
Figure 5
Figure 5
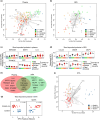
Olink protein levels in different compartments (plasma, nasopharyngeal aspirates (NPA) and endotracheal aspirates (ETA). (a, b, e) Supervised penalised star plots visualising the importance of proteins in separating the severity groups in (a) plasma and (b) NPA. The five most important proteins from the star plots in (c) plasma and (d) NPA. (c, d) Red colour indicates statistical significance compared to healthy controls (HC). (a–d) Only the first acute timepoint was used. COVID‐19 acute: plasma n = 109, NPA n = 37. Healthy controls (HC): plasma n = 9, NPA n = 9. (e) Venn diagram showing overlap of the 15 most important proteins from supervised penalised star plots in plasma and NPA. (f) ETA star plot, separating patients according to severity at sampling. In total, 55 COVID‐19 patient samples from n = 24 patients (all timepoints included). Intubated controls (IC) n = 10. (g) Univariate analysis comparing ETA protein levels in COVID‐19 patients, n = 24 and IC, n = 12. (a–g) A protein was included in the analysis if < 50% of batch normalised NPX values were zeros. NPX data are detrended for age, gender, and, in plasma, anticoagulant.
Figure 6
Figure 6
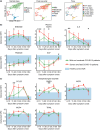
Olink protein levels in different anatomical compartments and across time in different severity groups. (a) Fruchterman–Reingold (FR) 2D embeddings showing clustering of samples based on Olink protein levels, displaying peak severity, sample type and time since onset. COVID‐19 acute: plasma 279 samples from n = 117 patients, NPA 48 samples from n = 46 patients, ETA 52 samples from n = 32 patients. COVID‐19 convalescence (3 months): plasma n = 93, NPA n = 31. HC: plasma n = 9, NPA n = 9. (b) Temporal dynamics of the most important proteins in Star plots, in plasma. HC n = 9, 373 samples from 118 patients. (c) Temporal dynamics of the most important proteins in Star plots in NPA. Data are shown from 79 samples from 52 patients. NPX data are detrended for age, gender, and anticoagulant. COVID‐19 patients colour‐coded by peak severity. Comparisons between groups were made with Mann–Whitney U‐tests. Stars (*) indicate significant differences compared to other time intervals.

References

    1. Diao B, Wang C, Tan Y et al. Reduction and functional exhaustion of T cells in patients with coronavirus disease 2019 (COVID‐19). Front Immunol 2020; 11: 827. - PMC - PubMed
    1. Liu Y, Du X, Chen J et al. Neutrophil‐to‐lymphocyte ratio as an independent risk factor for mortality in hospitalized patients with COVID‐19. J Infect 2020; 81: e6–e12. - PMC - PubMed
    1. Lucas C, Wong P, Klein J et al. Longitudinal analyses reveal immunological misfiring in severe COVID‐19. Nature 2020; 584: 463–469. - PMC - PubMed
    1. Kvedaraite E, Hertwig L, Sinha I et al. Major alterations in the mononuclear phagocyte landscape associated with COVID‐19 severity. Proc Natl Acad Sci USA 2021; 118: 118. - PMC - PubMed
    1. Schulte‐Schrepping J, Reusch N, Paclik D et al. Severe COVID‐19 is marked by a dysregulated myeloid cell compartment. Cell 2020; 182: 1419–1440. e1423. - PMC - PubMed

LinkOut - more resources