. 2024 Nov 20;12(2):uhae319.
doi: 10.1093/hr/uhae319. eCollection 2025 Feb.

Integrative multi-environmental genomic prediction in apple

Affiliations

Integrative multi-environmental genomic prediction in apple

Michaela Jung et al. Hortic Res. .

Abstract

Genomic prediction for multiple environments can aid the selection of genotypes suited to specific soil and climate conditions. Methodological advances allow effective integration of phenotypic, genomic (additive, nonadditive), and large-scale environmental (enviromic) data into multi-environmental genomic prediction models. These models can also account for genotype-by-environment interaction, utilize alternative relationship matrices (kernels), or substitute statistical approaches with deep learning. However, the application of multi-environmental genomic prediction in apple remained limited, likely due to the challenge of building multi-environmental datasets and structurally complex models. Here, we applied efficient statistical and deep learning models for multi-environmental genomic prediction of eleven apple traits with contrasting genetic architectures by integrating genomic- and enviromic-based model components. Incorporating genotype-by-environment interaction effects into statistical models improved predictive ability by up to 0.08 for nine traits compared to the benchmark model. This outcome, based on Gaussian and Deep kernels, shows these alternatives can effectively substitute the standard genomic best linear unbiased predictor (G-BLUP). Including nonadditive and enviromic-based effects resulted in a predictive ability very similar to the benchmark model. The deep learning approach achieved the highest predictive ability for three traits with oligogenic genetic architectures, outperforming the benchmark by up to 0.10. Our results demonstrate that the tested statistical models capture genotype-by-environment interactions particularly well, and the deep learning models efficiently integrate data from diverse sources. This study will foster the adoption of multi-environmental genomic prediction to select apple cultivars adapted to diverse environmental conditions, providing an opportunity to address climate change impacts.


Conflict of interest statement

The authors declare no conflicts of interest.

Figures
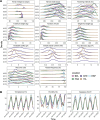
Figure 1
Figure 1
Phenotypic and weather data distributions. A, Density estimates for the adjusted means of eleven phenotypic traits from five locations and five years of measurement. The locations correspond to Belgium (BEL), Switzerland (CHE), Spain (ESP), France (FRA), and Italy (ITA). B, Local regression curves spanning five years estimated from daily temperature means, daily humidity means, and daily radiation sums. Colors correspond to legend in A.
Figure 2
Figure 2
Heat maps of the genomic relationship matrices. A, Standard genomic relationship matrix formula image based on a marker matrix using the standard coding for biallelic SNPs (allele dosage values of 0, 1, and 2). B, Additive genomic relationship matrix formula image based on marker matrix using the additive coefficients. C, Dominance genomic relationship matrix formula image based on marker matrix using the dominance coefficients. The matrices in A–C were constructed using the G-BLUP approach. D, Standard genomic relationship matrix formula image constructed deploying the Gaussian kernel (GK). E, Standard genomic relationship matrix formula image based on the Deep kernel (DK). The lower-left and upper-right quadrants show the apple REFPOP accessions and progenies, respectively.
Figure 3
Figure 3
The enviromic relationship matrix formula image constructed from the environmental covariates for weather and soil using G-BLUP. Environments (combinations of location and year) were grouped applying hierarchical clustering.
Figure 4
Figure 4
Relative contribution of different model components estimated for eleven traits. A, Average proportions of phenotypic variance related to genotypic (g) and genomic (G) effects, their interactions (×) with the vector of environments (E), the enviromic effects (W), the interaction effects G × W, as well as the residual effect extracted from the statistical genomic prediction model fits. The relationship matrices for the different effects in the statistical genomic prediction models were constructed using the G-BLUP approach or, where indicated, the Gaussian kernel (GK) or Deep kernel (DK). The statistical genomic prediction models were compared with a model based on phenotypic data (Phenotypic). Error bars correspond to standard deviation around the mean. B, Average proportions of phenotypic variance related to genomic (G), additive (A), and dominance (D) effects, their interactions (×) with the vector of environments (E), and the residual effect extracted from the statistical genomic prediction model fits. The model structures G and G + D were additionally extended with the fixed effect of inbreeding (inb). The relationship matrices for the different effects were based on G-BLUP. Error bars correspond to standard deviation around the mean. The results for the benchmark model G are the same as shown in A. C Relative contribution of the SNP, PC, weather, and soil feature streams estimated using SHAP for the deep learning genomic prediction model. Error bars correspond to standard deviation around the mean.
Figure 5
Figure 5
Comparison of predictive ability averaged across all studied traits. The statistical genomic prediction models were based on combinations of the genomic (G), additive (A), dominance (D), and enviromic (W) effects, interactions (×) with the vector of environments (E), and interactions between the genomic and enviromic effects (G × W). The model structures G and G + D were additionally extended with the fixed effect of inbreeding (inb). The relationship matrices for the different effects in the statistical genomic prediction models were constructed using the G-BLUP approach or, where indicated, the Gaussian kernel (GK) or Deep kernel (DK). The y-axis was truncated to provide a detailed model comparison. See Table S6 for a comparison of the predictive ability for each trait.
Figure 6
Figure 6
Boxplots of predictive abilities for eleven traits estimated using statistical and deep learning genomic prediction models. The statistical genomic prediction models were based on combinations of the genomic effects (G) and their interactions with the vector of environments (G × E). The relationship matrices for the different effects in the statistical genomic prediction models were constructed using the G-BLUP approach or, where indicated, the Gaussian kernel (GK). Twenty-five predictive ability estimates were generated for each available environment (up to 625 estimates per trait), and their average was displayed as black diamonds for each model and trait. Jittered points (gray) show all predictive ability estimates for each trait.

References

    1. Meuwissen THE, Hayes BJ, Goddard ME. Prediction of total genetic value using genome-wide dense marker maps. Genetics. 2001;157:1819–29 - PMC - PubMed
    1. García-Ruiz A, Cole JB, VanRaden PM. et al. Changes in genetic selection differentials and generation intervals in US Holstein dairy cattle as a result of genomic selection. Proc Natl Acad Sci. 2016;113:E3995–4004 - PMC - PubMed
    1. Voss-Fels KP, Cooper M, Hayes BJ. Accelerating crop genetic gains with genomic selection. Theor Appl Genet. 2019;132:669–86 - PubMed
    1. VanRaden PM. Efficient methods to compute genomic predictions. J Dairy Sci. 2008;91:4414–23 - PubMed
    1. Jarquín D, Crossa J, Lacaze X. et al. A reaction norm model for genomic selection using high-dimensional genomic and environmental data. Theor Appl Genet. 2014;127:595–607 - PMC - PubMed

LinkOut - more resources