. 2025 Apr;12(16):e2416143.
doi: 10.1002/advs.202416143. Epub 2025 Mar 5.

Simultaneous Reversal of T Lymphocytes and Cancer Cells Metabolism Via a Biomimetic Heavy-Atom-Free Photosensitizers-Based Combination Therapies to Boost Cancer Photoimmunotherapy

Affiliations

Simultaneous Reversal of T Lymphocytes and Cancer Cells Metabolism Via a Biomimetic Heavy-Atom-Free Photosensitizers-Based Combination Therapies to Boost Cancer Photoimmunotherapy

Yongjian Zhang et al. Adv Sci (Weinh). 2025 Apr.

Abstract

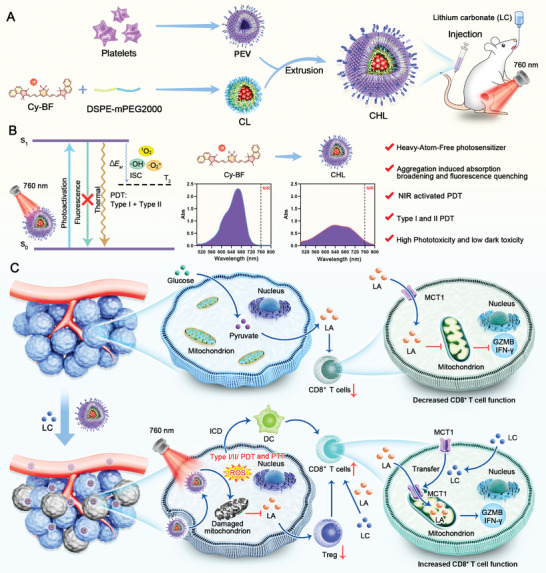
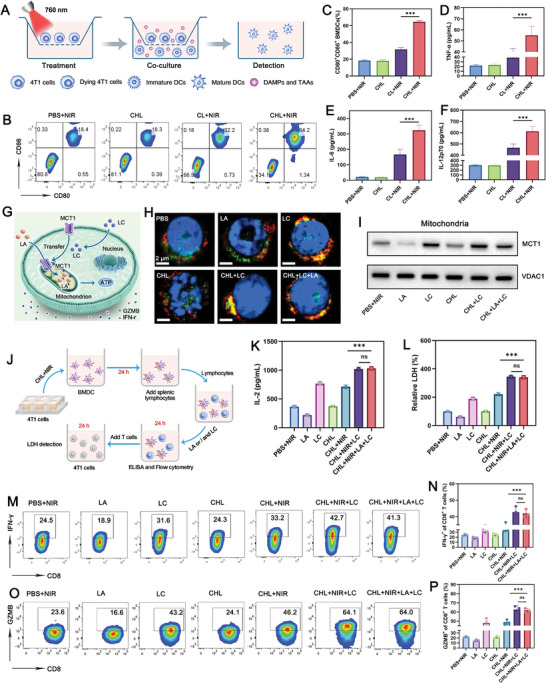
Near-infrared (NIR) activated photosensitizers based on heavy-atom-free have great advantages in photoimmunotherapy, yet the tumor microenvironment often restricts their efficacy. To address this, a NIR-activated heavy-atom-free photosensitizer (named Cy-BF) is developed. Cy-BF is then encapsulated with phospholipids and platelet exosome vesicles to create platelet exosomes vesicles biomimetic and Cy-BF loaded hybrid liposomes (named CHL) Characterized by high phototoxicity, low dark toxicity, and enhanced tumor targeting, CHL demonstrates aggregation-induced broadening of absorption spectra and NIR (760 nm laser) activates photothermal therapy and type I photodynamic therapy. The CHL-mediated phototherapy induces mitochondrial damage and immunogenic cell death in tumor cells, decreases lactate production, and alters the tumor microenvironment by reducing regulatory T cells and increasing CD8+ T cells. To mitigate T cell inhibition by excess lactate, a combination therapy is introduced using lithium carbonate, which repurposes lactate as an energy source for CD8+ T cells, thereby enhancing the effectiveness of CHL-mediated photoimmunotherapy. This combination approach represents a novel strategy for reversing lactate metabolism in both tumor cells and T cells, paving the way for future clinical applications in photoimmunotherapy.

Keywords: NIR activated type I/II PDT; T lymphocytes and cancer cells metabolism; heavy‐atom‐free photosensitizer; lithium carbonate; photoimmunotherapy.


Conflict of interest statement

The authors declare no conflict of interest.

Figures

Scheme 1
Scheme 1
Schematic illustration of Biomimetic heavy‐atom‐free photosensitizers collaborate with lithium carbonate reverses T lymphocytes and cancer cells metabolism to enhance near‐infrared activated photoimmunotherapy. A) The preparation process of CHL and combination therapy administration mode. B) Photophysical mechanism and advantages of the CHL. C) The in vivo mechanism of CHL combined with LC in anti‐tumor treatment. In untreated tumor tissue, the production of LA by tumor cells through glycolysis inhibits the mitochondrial function of CD8+ T cells, thereby suppressing the production of granzyme and cytokines in T cells. After combined treatment with CHL and LC, on the one hand, CHL‐mediated PDT and PTT induced tumor cell death and mitochondrial damage, reducing their LA production. On the other hand, LC reversed the immunosuppressive effect of LA on CD8+ T cells and instead enhanced the killing ability of CD8+T cells. This dual strategy ultimately leads to a systemic anti‐tumor immune response.
Figure 1
Figure 1
A) The chemical structural formula of Cy‐BF. B) HOMO‐LUMO distribution determined by DFT calculations for Cy‐BF. C) Energy levels for simplified monomeric and dimeric Cy‐BF at the optimized molecular geometries. D) Photoluminescence (PL) spectroscopy and E) absorption spectra of Cy‐BF in CHCl3 solution compared to CHL in PBS solution, using an excitation wavelength of 760 nm. F) TEM image of CL and G) CHL, including a magnified view of a particle. H) Particle diameter and Zeta potential measurements for PEV, CL, and CHL. Data are shown as the mean ± SD (n = 3). I) Stability of CHL in various solutions. J) Absorption spectra of CHL before and after exposure to 760 nm laser irradiation at 0.5W/cm2 for varying durations. K) Western blot (WB) analysis of key proteins in different formulations (I: Actin, II: P‐selectin, III: CD41) at a Cy‐BF concentration of 10 µg mL−1.
Figure 2
Figure 2
A) Heating profile of CHL containing different concentrations of Cy‐BF, PBS, and chloroform solution containing 200 ug mL−1 Cy‐BF under 760 nm laser irradiation (0.5W/cm2) for 3 min. Data are shown as the mean ± SD (n = 3). B) Photothermal cycling curves of different formulations. C) Calculation of the time constant for heat transfer using a linear regression of the CHL cooling profile. D) Production of 1O2, E) •OH and F) •O2 by the CHL or CHL+NIR (0.5 W cm−2, 3 min) was determined by ESR. G) Fluorescence spectra of SOSG, H) HPF, and I) DCF after CHL plus 760 nm laser irradiation (0.5 W cm−2) for different times. J) Fluorescence images and flow cytometry analysis of intracellular ROS treated with different components (NIR: 760 nm laser, 0.5 W cm−2, 10 min). Scale bars: 20 µm.
Figure 3
Figure 3
A) JC‐1 flow cytometry analysis and B) apoptosis detection of 4T1 cells treated with different components (NIR: 760 nm laser, 0.5 W cm−2, 10 min). C) Expression of HMGB1 and CRT (scale bars: 10 µm) and D) HMGB1 release from 4T1 cells following treatment with different formulations (NIR: 760 nm laser, 0.5 W cm−2, 10 min). E) Intracellular GSH and F) lactate levels after different treatments. Cy‐BF concentration: 100 µg mL−1. G) The relative cellular viability of 4T1 cells after various treatments with different Cy‐BF concentrations. NIR: 760 nm laser, 0.5 W cm−2, 10 min. Data are shown as the mean ± SD (n = 3). Statistical significance was calculated via one‐way ANOVA with Tukey's test: *** p < 0.001.
Figure 4
Figure 4
A) Heatmap illustrating differentially expressed genes after treatment. B) The Venn diagram revealed the number of genes transcribed in the indicated treatment group. C) Volcano plots illustrating differentially expressed genes. D) Results of KEGG pathway enrichment analysis. E) Heatmap of gene expressions related to apoptosis, immunity, and oxidative stress in 4T1 cells treated with PBS + NIR and CHL + NIR.NIR: 760 nm laser, 0.5 W cm−2, 10 min.
Figure 5
Figure 5
A) Schematic illustration of the Transwell system of the Transwell system used to induce maturation of BMDCs in vitro. B) Flow cytometry analysis and C) quantitative analysis of mature BMDCs after different treatments. The Cy‐BF concentration was 20 µg mL−1. Data are shown as the mean ± SD (n = 3). D) The levels of TNF‐α, E) IL‐6, and F) IL‐12p70 secreted by matured BMDCs. G) A schematic showing how LC facilitates the translocation of MCT1 from the T cell membrane to mitochondria. H) Immunofluorescence staining of MCT1 and COX IV in CD8+ T cells treated with indicated formulations. Blue: Nuclei, Green: COX IV and Red: MCT1. I) Western blot of MCT1 in the mitochondria of CD8+ T cells treated with indicated formulations. J) A schematic representing specific immune activation experimental setups in vitro. K) Detection of IL‐2 in supernatant from treated CD8 + T cells by ELISA after LA or/and LC for 24h. L) Measurement of LDH levels in the supernatant after co‐incubation of the splenic T lymphocytes with 4T1 tumor cells for 24h. M) Representative plots and N) quantification of IFN‐γ in CD8+ T cells after different treatments analyzed by the flow cytometry. O) Representative plots and P) quantification of granzyme B (GZMB) in CD8+ T cells after different treatments analyzed by flow cytometry. LA and LC were used at a concentration of 10 mM, and Cy‐BF at 100 µg mL−1 Data are shown as the mean ± SD (n = 3). Statistical significance was calculated via one‐way ANOVA with Tukey's test: ns: Non‐Significant, *** p < 0.001.
Figure 6
Figure 6
A) Ex vivo fluorescence imaging and corresponding intensity data of tumors and organs from 4T1 tumor‐bearing mice at various post‐injection intervals of CL or CHL. B) Infrared thermography of tumor tissue after different treatments. C) A schematic Diagram outlining the timeline for tumor inoculation, nanodrug administration, laser treatment, and monitoring of tumor growth. D) Survival curves after treatment. E) Tumor volumes were measured every 3 days across all groups. F) Tumor weights were recorded for each treatment at the end of the study. G) Relative lactate content in 4T1 tumor tissues after different treatments. H) H&E, TUNEL, CRT, and Ki‐67 staining of tumor sections after the indicated treatments. Scale bars: 20 µm. I) Schematic illustration of western blotting analysis of protein expression in CD8+ T cells. J) Western blotting analysis of VDAC1 and MCT1 expression in CD8+ T cell mitochondrion. Cy‐BF dose: 10 mg kg−1. Data are shown as the mean ± SD (n = 5). Statistical significance was calculated via one‐way ANOVA with Tukey's test: *** p < 0.001.
Figure 7
Figure 7
A) Flow cytometry data showing the effects of treatments on DCs maturation in lymph nodes, infiltration of CD3+ CD8+ T lymphocytes in 4T1 tumor tissues, and levels of IFN‐γ+ and GZMB+ cells among CD8+ T cells, as well as CD25+ Foxp3+ Tregs in tumor tumor tissues. B) Quantitative analysis of DCs maturation in lymph nodes induced by treatments, C) CD3+ CD8+ T lymphocytes infiltration in the 4T1 tumor tissues, D) IFN‐γ+ and E) GZMB+ cells among CD8+ T cells, and F) CD4+ Foxp3+ Tregs in tumor tissues. G) Secretion of pro‐inflammatory cytokines (TNF‐α, IFN‐γ, and IL‐6) in sera after exposure to different treatments. Data are shown as the mean ± SD (n = 5). Statistical significance was calculated via one‐way ANOVA with Tukey's test: ** p < 0.01, *** p < 0.001.
Figure 8
Figure 8
A) Schematic illustration of the studies of 4T1 bilateral tumor therapy. B) Survival curves after different treatments. C) Evolution of the primary tumor volume and D) tumor weight after various treatments. E) Development of distant tumor volume and F) tumor weight following various treatments. G) Changes in body weight during the treatment period. H) H&E and CD8 staining analyses of distant tumor tissues after different treatments. I) Quantification of treatment‐induced IFN‐γ+ cells among CD8+ T cells. J) Levels of pro‐inflammatory cytokines (TNF‐α and K) IFN‐γ) in serum following different treatments. L) Schematic illustration of the studies of 4T1 tumor therapy. M) Lactate content in tumor tissue after different treatments. N) Survival curves after different treatments. O) Changes in tumor volume and P) tumor weight after different treatments. Q) H&E and CD8 staining analyses of tumor tissues treated with various treatments. R) Flow cytometry analysis and S) Quantification of CD3+ CD8+ T lymphocytes infiltration in the 4T1 tumor tissues. T) Quantification of treatment‐induced IFN‐γ+ and U) GZMB+ cells among CD8+ T cells. Data are shown as the mean ± SD (n = 5). Statistical significance was calculated via one‐way ANOVA with Tukey's test: ** p < 0.01, *** p < 0.001.

References

    1. a) Niu B., Liao K., Zhou Y., Wen T., Quan G., Pan X., Wu C., Biomaterials 2021, 277, 121110; - PubMed
    2. b) Chen Q., Chen M., Liu Z., Chem. Soc. Rev. 2019, 48, 5506. - PubMed
    1. Liu Y., Bhattarai P., Dai Z., Chen X., Chem. Soc. Rev. 2018, 48, 2053. - PMC - PubMed
    1. a) Hu F., Xu S., Liu B., Adv. Mater. 2018, 30, 1801350; - PubMed
    2. b) Wang K., Li Y., Wang X., Zhang Z., Cao L., Fan X., Wan B., Liu F., Zhang X., He Z., Zhou Y., Wang D., Sun J., Chen X., Nat. Commun. 2023, 14, 2950; - PMC - PubMed
    3. c) Zhu D., Duo Y., Meng S., Zhao Y., Xia L., Zheng Z., Li Y., Tang B. Z., Angew. Chem. 2020, 59, 2. - PubMed
    1. a) Ning S., Lyu M., Zhu D., Lam J. W. Y., Huang Q., Zhang T., Tang B. Z., ACS Nano 2023, 17, 10206; - PubMed
    2. b) Zhu D., Zheng Z., Luo G., Suo M., Li X., Duo Y., Tang B. Z., Nano Today 2021, 37, 101091;
    3. c) Wang X., Sun W., Shi H., Ma H., Niu G., Li Y., Zhi J., Yao X., Song Z., Chen L., Li S., Yang G., Zhou Z., He Y., Qu S., Wu M., Zhao Z., Yin C., Lin C., Gao J., Li Q., Zhen X., Li L., Chen X., Liu X., An Z., Chen H., Huang W., Nat. Commun. 2022, 13, 5091; - PMC - PubMed
    4. d) Zhu D., Zhang T., Li Y., Huang C., Suo M., Xia L., Xu Y., Li G., Tang B. Z., Biomaterials 2022, 283, 121462. - PubMed
    1. a) Ning S., Suo M., Huang Q., Gao S., Qiao K., Lyu M., Huang Q., Zhang T., Tang B. Z., Nano Today 2024, 54, 102106;
    2. b) Chen Z., Liu Z., Zhou Y., Rao K., Lin J., Zhu D., Ning S., Wang H., Mater.Today Bio 2024, 28, 101217; - PMC - PubMed
    3. c) Ning S., Zhang X., Suo M., Lyu M., Pan Y., Jiang Y., Yang H., Yip Lam J. W., Zhang T., Pan L., Tang B. Z., Cell Rep. Phys. Sci. 2023, 4, 101505;
    4. d) Chen Q., Hu Q., Dukhovlinova E., Chen G., Ahn S., Wang C., Ogunnaike E. A., Ligler F. S., Dotti G., Gu Z., Adv. Mater. 2019, 31, 1900192. - PMC - PubMed

Substances

LinkOut - more resources