. 2025 Mar;21(3):e70014.
doi: 10.1002/alz.70014.

Polygenic score integrating neurodegenerative and vascular risk informs dementia risk stratification

Affiliations

Polygenic score integrating neurodegenerative and vascular risk informs dementia risk stratification

Tim D'Aoust et al. Alzheimers Dement. 2025 Mar.

Abstract

Introduction: An integrative polygenic risk score (iPRS) capturing the neurodegenerative and vascular contribution to dementia could identify high-risk individuals and improve risk prediction.

Methods: We developed an iPRS for dementia (iPRS-DEM) in Europeans (aged 65+), comprising genetic risk for Alzheimer's disease (AD) and 23 vascular or neurodegenerative traits (excluding apolipoprotein E [APOE]). iPRS-DEM was evaluated across cohorts comprising older community-dwelling people (N = 3702), a multi-ancestry biobank (N = 130,797 Europeans; 105,404 non-Europeans), and dementia-free memory clinic participants (N = 2032).

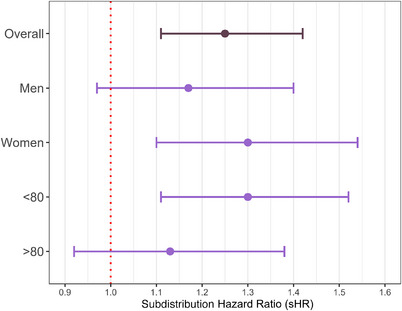
Results: iPRS-DEM was associated with dementia risk independently of APOE in the elderly (subdistribution hazard ratio [sHR]per1SD = 1.15, 95% confidence interval [CI]: 1.03 to 1.28), which generalized to Europeans (EUR-sHRper1SD = 1.28, 95% CI: 1.09 to 1.51]), East-Asians (EAS-sHRper1SD = 5.29, 95% CI: 1.43 to 34.36), and memory-clinic participants (sHRper1SD = 1.25, 95% CI: 1.11 to 1.42). Prediction was comparable to clinical risk factors in older community-dwelling people, with improved performance among memory-clinic patients. Risk stratification was enhanced by defining four genetic risk groups with iPRS-DEM and APOE ε4, reaching five-fold increased risk in APOE ε4+/iPRS-DEM+ memory-clinic participants.

Discussion: Alongside APOE ε4, iPRS-DEM may refine risk stratification for the enrichment of dementia clinical trials and prevention programs.

Highlights: iPRS-DEM reflects neurodegenerative and vascular contribution to dementia. We show iPRS-DEM captures additional dementia genetic risk beyond APOE and AD-PRS. iPRS-DEM, in combination with APOE ε4, shows promise for dementia risk stratification. Our results generalize across both population-based and memory-clinic settings. We show transportability of iPRS-DEM to East Asian ancestry.

Keywords: apolipoprotein E genotype; community‐dwelling elderly; competing risk analysis; dementia prevention; incident dementia; longitudinal study; memory clinic; multi‐ancestry biobank; polygenic risk score; transportability of PRS; vascular cognitive impairment.


Conflict of interest statement

The authors of this manuscript have no competing interests to declare. Author disclosures are available in the Supporting Information.

Figures

FIGURE 1
FIGURE 1
Overview of derivation and validation of iPRS‐DEM. At each step of iPRS‐DEM generation, we used Fine‐Gray regression models. LDPRED2, PRS‐CS, and C+T are validated methods to derive PRS using distinct combinations of tuning parameters. Candidate PRS models for each trait were selected based on integrative Brier score across 5‐, 7.5‐, and 10‐year horizons. For each selected single‐trait PRS the penalized coefficients from elastic‐net were divided by the empirical standard deviation to derive training weights. Training weights were used to re‐weight the effect size of SNPs included in their respective single‐trait PRS. aUK Biobank was used as a reference panel for LDPRED2 PRS models as provided by the software. The 1000G European Subset was used as a reference panel for both PRS‐CS and C+T. bClinical risk factor analyses included assessing the change in the estimate of iPRS‐DEM after adjustment for risk factors and prediction performance at 10‐year follow‐up in 3C and 5‐years in Memento. In Memento, 1,952 participants had complete clinical risk factor data; however, only family history of dementia and low education were used in prediction models (positively associated with dementia risk) corresponding to 2,021 individuals in this analysis. cIn analyses stratified by APOE ε4, we removed those with APOE ε2/ε4 genotype. These analyses included interaction models and stratifying individuals into genetic risk groups. AFR, African‐American ancestry; C+T, clumping and thresholding; cSVD, cerebral small vessel disease; EAS, East Asian ancestry; EUR, European ancestry; HIS, Hispanic ancestry; LD, linkage disequilibrium; PRS, polygenic risk score(s); QC, quality control; sPRS, single‐trait polygenic risk score(s).
FIGURE 2
FIGURE 2
Validation of iPRS‐DEM in 3C‐Dijon. (A) Association of iPRS‐DEM with cumulative incidence of dementia across percentile groups. Subdistribution hazard ratios for dementia are per percentile cutoffs relative to the rest of the sample as derived from Fine‐Gray regression models. (B) Comparison of genetic risk strata defined by APOE ε4 status and iPRS‐DEM. (B1) Estimated cumulative incidence curves at ages 75 to 95 years across genetic risk strata. (B2) Association across APOE ε4 and iPRS‐DEM defined genetic risk strata with cumulative incidence of dementia. All models in each analysis were adjusted for age at baseline (including age‐squared), sex, and 10 principal components, as well as APOE ε2 and APOE ε4 dosage (except for APOE ε4 stratified analysis). AD‐PRS, Alzheimer's disease polygenic risk score; APOE4‐, APOE ε4 non‐carriers; APOE4+, APOE ε4 carriers; AUC, area under the curve; CVD, cardiovascular disease; IPA, index of prediction accuracy; iPRS, integrative polygenic risk score; sHR, subdistribution hazard ratio. (C) Comparison of prediction performance at 10 years of iPRS‐DEM against APOE, AD‐PRS, and clinical risk factors* based on time‐dependent AUC and index of prediction accuracy over 2000 bootstrap replications (*only risk factors showing significant association with increased cumulative incidence of all‐cause dementia in 3C‐Dijon are used here).
FIGURE 3
FIGURE 3
iPRS‐DEM association with cumulative incidence of dementia in 3C‐Dijon, including age and sex subgroups. Error bars represent 95% confidence intervals. All Fine‐Gray models are adjusted for age at baseline, sex, 10 genetic principal components, and APOE ε2 and APOE ε4 dosage. <80 refers to analysis censoring at 80 years old, >80 refers to analysis excluding data before age 80; see eMethods 6 for details.
FIGURE 4
FIGURE 4
External validation of iPRS‐DEM in Memento. (A) Association of iPRS‐DEM with cumulative incidence of dementia across percentile groups. Subdistribution hazard ratios for dementia are per percentile cutoffs relative to the rest of the sample as derived from Fine‐Gray regression models. Models are adjusted for age at baseline, sex, and 10 principal components, as well as APOE ε4 and ε2dosage. (B) Comparison of genetic risk strata defined by APOE ε4 status and iPRS‐DEM. (B1) Estimated cumulative incidence curves at up to 5‐year follow‐up across genetic risk strata. (B2) Association across APOE ε4 and iPRS‐DEM defined genetic risk strata with cumulative incidence of dementia. All models in each analysis are adjusted for age at baseline, sex, and 10 principal components, as well as APOE ε2 and APOE ε4 dosage (except for APOE ε4 stratified analysis). AUC, area under the curve; APOE4−, APOE ε4 non‐carriers; APOE4+, APOE ε4 carriers; EDU, low education; IPA, index of prediction accuracy; iPRS, integrative polygenic risk score; sHR, subdistribution hazard ratio. (C) Comparison of prediction performance at 5 years of iPRS‐DEM against APOE, AD‐PRS, and clinical risk factors* based on time‐dependent area under the curve and index of prediction accuracy over 2000 bootstrap replications (*only risk factors showing significant association with increased cumulative incidence of all‐cause dementia in Memento are used here).
FIGURE 5
FIGURE 5
iPRS‐DEM association with cumulative incidence of dementia in Memento including age and sex subgroups. Error bars represent 95% confidence intervals. All Fine‐Gray models are adjusted for age at baseline, sex, 10 genetic principal components, and APOE ε2 and APOE ε4 dosage. <80 refers to analysis censoring at 80 years old, >80 refers to analysis excluding data before age 80, see eMethods 6 for details.

References

    1. Nichols E, Steinmetz JD, Vollset SE, et al. Estimation of the global prevalence of dementia in 2019 and forecasted prevalence in 2050: an analysis for the Global Burden of Disease Study. Lancet Public Health. 2019;7(2):e105‐e125. doi:10.1016/S2468-2667(21)00249-8 - DOI - PMC - PubMed
    1. Gladman JT, Corriveau RA, Debette S, et al. Vascular contributions to cognitive impairment and dementia: research consortia that focus on etiology and treatable targets to lessen the burden of dementia worldwide. Alzheimers Dement Transl Res Clin Interv. 2019;5:789‐796. doi:10.1016/j.trci.2019.09.017 - DOI - PMC - PubMed
    1. Snyder HM, Corriveau RA, Craft S, et al. Vascular contributions to cognitive impairment and dementia including Alzheimer's disease. Alzheimers Dement. 2015;11(6):710‐717. doi:10.1016/j.jalz.2014.10.008 - DOI - PMC - PubMed
    1. Schneider JA, Arvanitakis Z, Bang W, Bennett DA. Mixed brain pathologies account for most dementia cases in community‐dwelling older persons. Neurology. 2007;69(24):2197‐2204. doi:10.1212/01.wnl.0000271090.28148.24 - DOI - PubMed
    1. van der Flier WM, Skoog I, Schneider JA, et al. Vascular cognitive impairment. Nat Rev Dis Primer. 2018;4(1):1‐16. doi:10.1038/nrdp.2018.3 - DOI - PubMed

Substances