. 2025 Mar 5;149(1):23.
doi: 10.1007/s00401-025-02858-7.

Human brain tissue with MOGHE carrying somatic SLC35A2 variants reveal aberrant protein expression and protein loss in the white matter

Affiliations

Human brain tissue with MOGHE carrying somatic SLC35A2 variants reveal aberrant protein expression and protein loss in the white matter

Erica Cecchini et al. Acta Neuropathol. .

Abstract

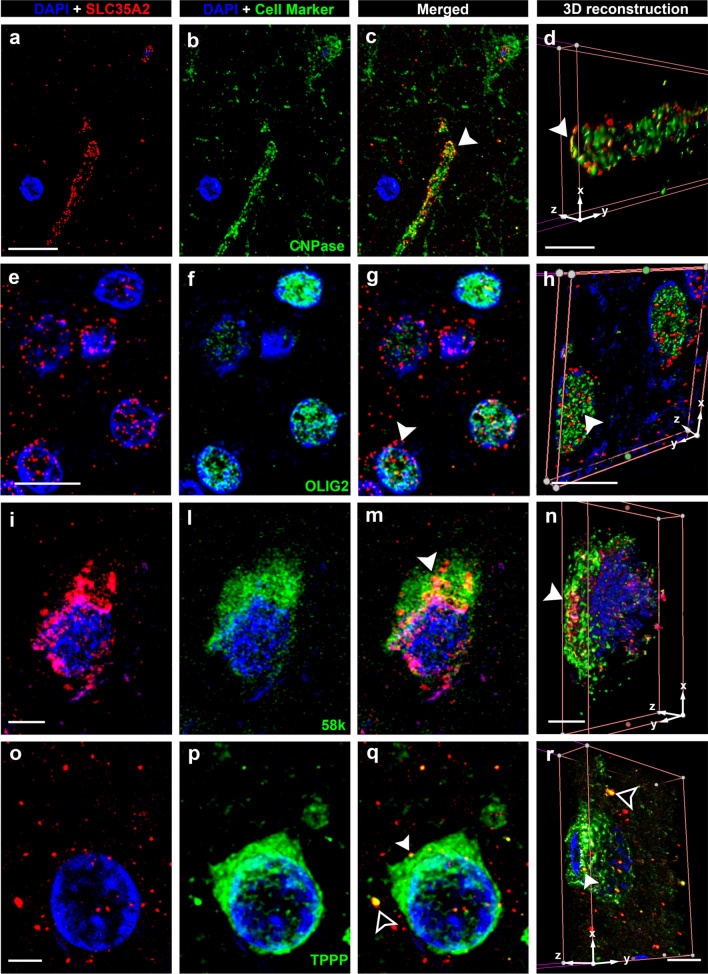
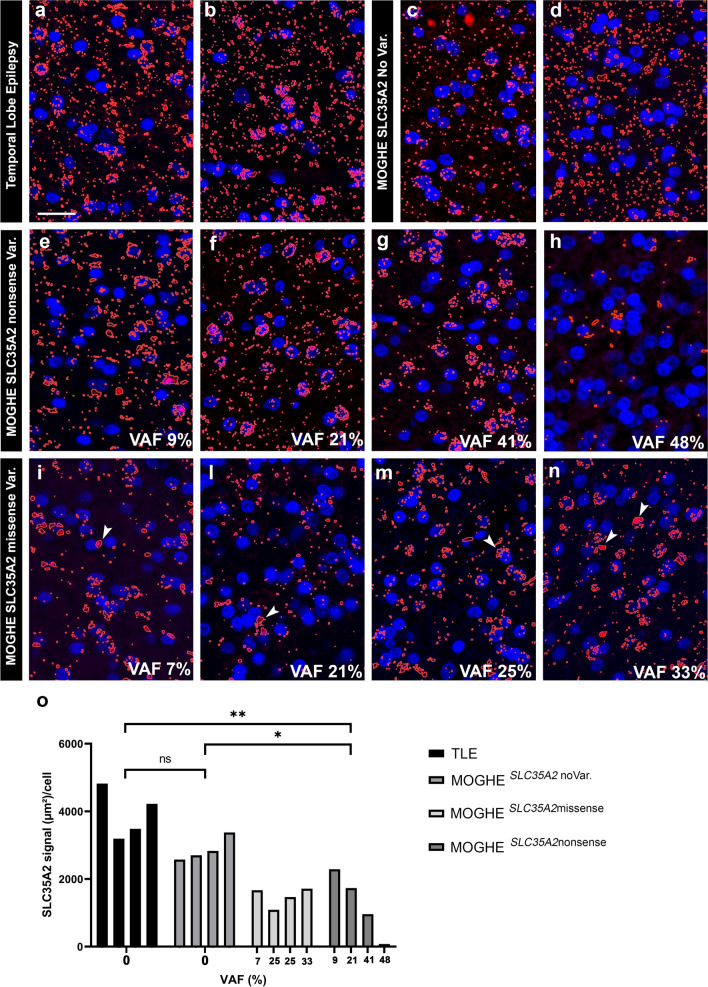
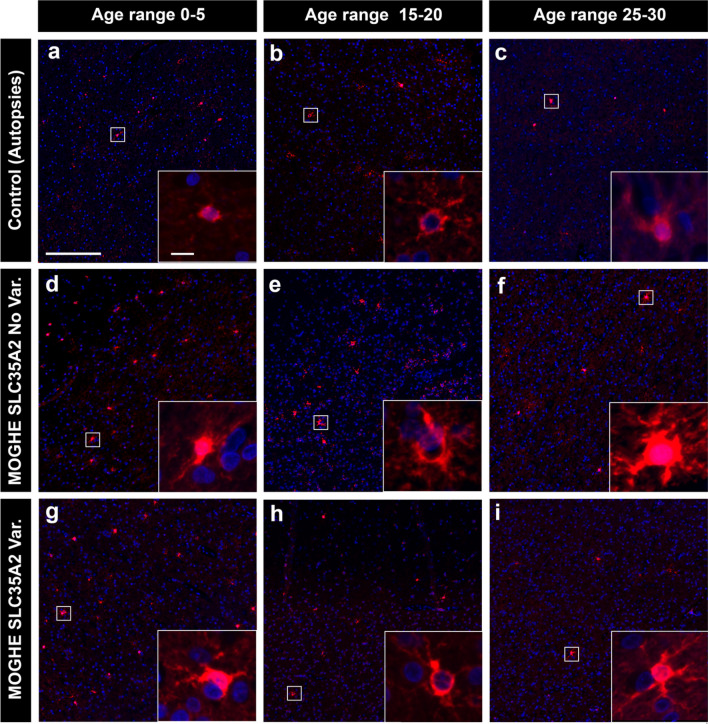
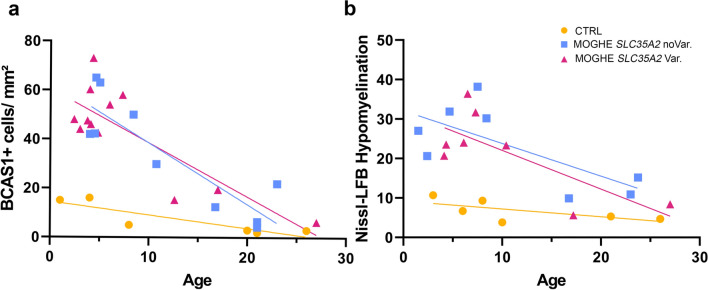
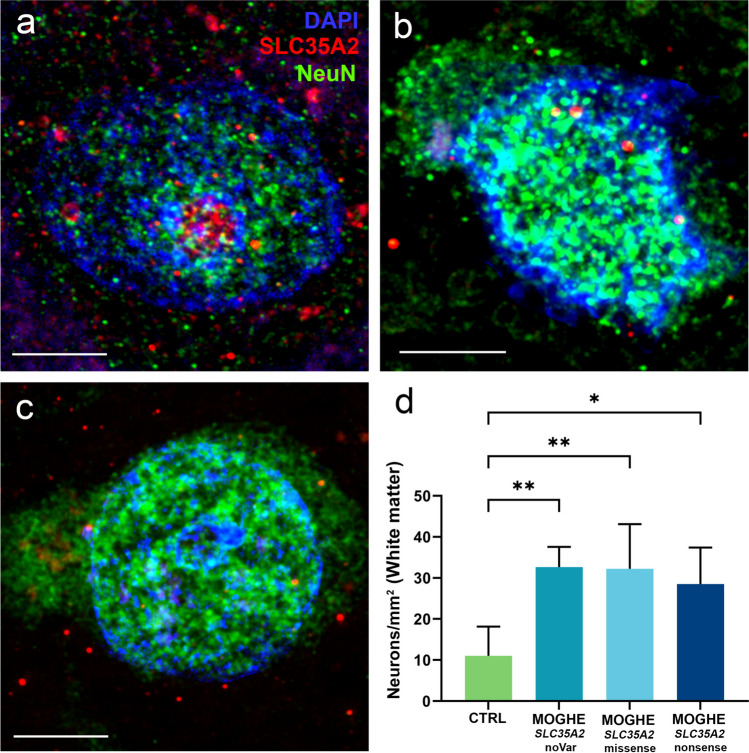
Mild Malformation of Cortical Development with Oligodendroglial Hyperplasia in Epilepsy (MOGHE) is a recently described disease entity primarily affecting young children with drug-resistant epilepsy, mainly affecting the frontal lobe. The condition is histopathologically defined by focal lesions with patchy areas of increased oligodendroglial cell density at the grey-white matter boundary and heterotopic neurons in the white matter. Approximately half of the individuals with MOGHE carry brain somatic variants in the SLC35A2 gene, which affects the UDP-galactose transporter and thus sphingolipid glycosylation. To investigate the impact of SLC35A2 variants on protein expression, we analysed MOGHE brain tissue with and without SLC35A2 mosaicism, distinguishing missense from nonsense variants. We developed an antibody targeting the N-terminus of the SLC35A2 galactose transporter and applied it for immunofluorescence (IF) analyses in a MOGHE cohort comprising 59 genetically tested individuals selected from three centres in Germany. The cohort included 13 individuals with SLC35A2 missense variants and 15 with SLC35A2 nonsense variants. Our findings confirm the localisation of the SLC35A2 protein in the Golgi apparatus of all neuroepithelial cell types as well as within Golgi outposts along oligodendroglial processes. The protein distribution was altered in MOGHE samples dependent on the SLC35A2 variant and its allelic frequency. Western blot and IF analyses revealed a significant SLC35A2 reduction in MOGHE tissues carrying nonsense variants. Ultrastructural analyses from three MOGHE samples demonstrated hypomyelination in regions with increased oligodendroglial cell densities, regardless of the harbouring of SLC35A2 variants. Notably, this hypomyelination pattern decreased with age. These results suggested a role for the SLC35A2 protein in the pathogenesis of MOGHE and indicated the presence of additional myelin-associated pathomechanisms in those individuals who do not carry a pathogenic SLC35A2 variant.

Keywords: Brain; Epilepsy; MOGHE; Myelin; Neuropathology; Oligodendrocytes.


Conflict of interest statement

Declarations. Conflict of interest: The authors declare that there are no competing interests.

Figures

Fig. 1
Fig. 1
Confocal laser scanning microscopy of SLC35A2. Representative immunofluorescent images arranged in a 4 × 4-panel format. Panels a, e, i, and o on the far left display DAPI (blue nuclear stain) alongside SLC35A2 immunoreactivity (in red colour). Panels b, f, l, and p on the middle-left represent DAPI merged with cell-specific markers: CNPase, a myelin marker (b, c, d); OLIG2, a marker for oligodendrocytes nuclei (f, g, h) 58 k, a Golgi apparatus marker (l, m, n); and TPPP, a Golgi outpost marker (p, q, r). Panels c, g, m, and q on the middle-right present merged images from previous columns at the same resolution. Panels d, h, n, and r on the far right panel provide a higher resolution of the merged picture by 3D reconstruction and in-depth views of signal localization within cellular structures. Protein–protein colocalization of SLC35A2 is evident with CNPase (c, d), 58 k (m, n), and TPPP (p, q) in merged images (yellow signal, white arrowheads). Notably, SLC35A2 colocalizes with TPPP in both perinuclear regions and areas distal to the nucleus (q, r). Scale bar in a: 10 µm (applies to b and c); in d: 3 µm; in e: 10 µm (applies to f and g); in h: 4 µm; in i: 4 µm (applies to l and m); in n: 4 µm; in o: 2.5 µm (applies to p and q) and in r: 4 µm. Arrowheads in c, g, m, and q match corresponding regions in the 3D reconstructions (d, h, n, and r) for spatial reference. Sample IDs: panels a–d (CTRL.3, male); Panels e–h (CTRL.4, male); Panels i-n (CTRL.5, male); Panels o-r (CTRL.6, female)
Fig. 2
Fig. 2
Confocal laser scanning microscopy of SLC35A2 cont’d. Representative Immunofluorescent images are arranged in a 4 × 4-panel format as in Fig. 1. Cell-specific markers include NeuN, a marker for neuronal nuclei (b, c, d); MAP2, a microtubule-associated protein in neuronal dendrites (f, g, h) BCAS1, a marker for myelinating oligodendrocytes (l, m, n); and GFAP, a marker for astrocytes (p, q, r). Protein–protein colocalization of SLC35A2 is identified with NeuN (c, d) and BCAS1 (m, n, see inset in n). No clear colocalization is observed with MAP2 (g, h) and GFAP (q, r). Scale bar in a: 5 µm (applies to b and c), in d: 4 µm, in e: 10 µm (applies to f and g), in h: 5 µm in i: 10 µm (applies to l and m), in n: 12 µm, in o: 10 µm (applies to p and q), and in r: 5 µm. Arrowheads in c, g, m, and q match corresponding regions in the 3D reconstructions (d, h, n, and r) for spatial reference. Sample IDs: panels a–d (CTRL. 3, male); Panels e–h (CTRL.4, male) Panels i–n (CTRL.23, male); Panels o-r (CTRL.5, male)
Fig. 3
Fig. 3
SLC35A2 immunofluorescence staining in MOGHE according to different variant types and their VAF. Immunofluorescence staining of the SLC35A2 epitope obtained from controls and individuals with MOGHE (in red colour). a, b TLE control samples showed the characteristic dotted labelling pattern at perinuclear sites as well as scattered throughout the brain tissue (white matter). c, d: MOGHESLC35A2noVar. samples shared the same immunolabelling pattern observed in controls. e–h: MOGHESLC35A2nonsense samples. Note the progressive loss of the SLC35A2 protein signal when the VAF increased. i–n: MOGHESLC35A2missense samples. Note the preferentially perinuclear SLC35A2 immunoreactivity pattern in MOGHE samples with missense variants (white arrowheads in i, l, m and n). The higher VAF, point not only to a protein loss but also to an apparent altered protein distribution. o: SLC35A2 signal quantification in genetically defined groups. The graph displays the ratio of the SLC35A2 protein signal expressed in square µm per cell (Y axis) relative to the variant allele frequency of the SLC35A2 gene (X axis). Data are shown for four genetically defined groups: TLE, MOGHESLC35A2missense, MOGHESLC35A2nonsense, and MOGHESLC35A2noVar. Each group included four independent samples. The results revealed a significant loss of SLC35A2 signal per cell in MOGHESLC35A2nonsense compared to the TLE (p 0.0053) and MOGHESLC35A2noVar.(p 0.0375). Scale bar = 20 µm. Sample IDs: Panel a (CTRL. 10, female); Panel b (CTRL. 5, male); Panel c (ID 21, male); Panel d (ID 9, male); Panel e (ID 50, male); Panel f (ID 51, female); Panel g (ID 54, male); Panel h (ID 47, male); Panel i (ID 36, female); Panel l (ID 40, male); Panel m (ID 38, male); Panel n (ID 44, female). All the previous samples plus CTRL.4, male, TLE, CTRL. 6, male, TLE, ID 2, male, MOGHESLC35A2noVar., and ID 8, male, MOGHESLC35A2noVar (IF not shown in the figure) were used to create the statistical analysis in o
Fig. 4
Fig. 4
Western blot analysis. a Columns 1, 2, and 3 (IDs: CTRL. 1, CTRL.2, CTRL.3, all males) represent individuals with temporal lobe epilepsy (TLE) as controls. Column 4 (ID 47, male), column 5 (ID 54, male), column 6 (ID 52, female), and column 7 (ID 50, male) represent MOGHESLC35A2nonsense samples with a VAF of 48%, 41%, 30%, and 9% respectively. SLC35A2 immunostaining of the blotted protein lysates revealed three distinct bands: the lower band represents the monomeric form of SLC35A2 at approximately 34 kDa, the upper band represents the dimerized form of SLC35A2 at approximately 70 kDa, and the middle band indicates the dimerized form of SLC35A2 with SLC35A3 at approximately 55 kDa. Notably, all MOGHE cases revealed protein loss with the most pronounced reduction in Column 4 (48% VAF). b Statistical analysis indicated a significant reduction in protein levels in the lower and middle bands when comparing controls to MOGHESLC35A2nonsense. The non-significant difference in the upper band is attributed to high standard deviation among control samples, particularly due to the low detection of the dimerized form in the control sample 3
Fig. 5
Fig. 5
Oligodendroglial cell density heat maps in MOGHE. a Heat map showing oligodendrocyte density in a 5-year-old individual with MOGHESLC35A2noVar. (ID 24, female). Regions of high oligodendroglial cell density are depicted in red, with the inset highlighting a cluster. b Heat map from an individual with FCDIIa (ID CTRL.14, female, 6 years old), illustrating an even distribution of oligodendrocytes and increased oligodendroglial satellitosis along blood vessels (inset). c Nissl-LFB staining from the same MOGHE individual shown in a reveals extended patchy discolouration areas, consistent with hypomyelination. d Higher magnification of the region shown in c, illustrating structural features in more detail. e Heat map corresponding to the same area shown in d, emphasizing oligodendroglial cell cluster. f Overlay of d and e, confirming alignment between hypomyelination (discolouration in Nissl-LFB) and regions of increased oligodendroglial cell density. g Bar graph depicting average oligodendroglial cell density (cells/mm2) across four groups: MOGHE with SLC35A2 Variants, MOGHESLC35A2noVar. FCDIIa, and Autopsy. Oligodendrocyte density is significantly higher in MOGHE cases with and without SLC35A2 variants compared to non-epileptic specimens (p < 0.0001) and FCDIIa (p < 0.001; and p < 0.05). h Bar graph representing oligodendroglial cell density (cells/mm2) for each of the 40 individual specimens analyzed in panel g, categorized into four groups: MOGHE with SLC35A2 Variant (blue), MOGHESLC35A2noVar. (purple), FCDIIa (fuchsia), and Autopsy specimens (green). Digits beneath the X axis indicate the lowest and highest ages within each group. Scale bars: a: 4 mm; b: 3 mm; c: 2 mm; d–f: 1 mm; insets in a and b: 40 µm
Fig. 6
Fig. 6
Age-related patchy discolouration of Nissl-LFB in samples with MOGHE. Representative Nissl-Luxol Fast Blue (Nissl-LFB) stained sections showing myelin content across age and genetically defined groups. The figure includes 16 images organized in a 4 × 4 grid, with rows corresponding to four age ranges (0–3 years old: a–d, 4–8 years old: e–h, 9–17 years old: i–l, and over 18 years old: o–r) and columns representing different groups (Controls (CTRL): a, e, i, o; MOGHESLC35A2noVar: b, f, l, p; MOGHESLC35A2missense: c, g, m, q; MOGHESLC35A2nonsense: d, h, n, r). Nissl-LFB staining revealed patchy areas of low myelin content in MOGHE patients aged 0–8 years (b, c, d, f, g, h). These patchy discolorations were observed in MOGHE patients and were absent in the control group, which included autopsy samples and tissue from individuals with FCDIIa. The hypomyelination pattern became progressively less pronounced with age in MOGHE patients (l, m, n, p, q, r). Sample IDs: Panel a (CTRl.23); Panel b (ID 30, male); Panel c (ID 39, male); Panel d (ID 51, female); Panel e (CTRL. 14); Panel f (ID 31, male); Panel g (ID 42, male); Panel h (ID 57, male); Panel i (CTRL. 25); Panel l (ID 2, male), Panel m (ID 36, female), Panel n (ID 45, male); Panel o (CTRL. 28), Panel p (ID 22, male), Panel q (ID 32, male), Panel r (ID 59, female)
Fig. 7
Fig. 7
Electron micrographs of surgically resected MOGHE. a The perilesional area to MOGHE revealed high-density axonal cross sections at the level of the white matter (ID 7, male, 5 years old, MOGHESLC35A2noVar.). b A MOGHE white matter lesion area with reduced density of myelinated axons and hypomyelinated axonal cross sections (ID 43, female, 44 years old, MOGHESLC35A2missense with 8% VAF). c Higher magnification of MOGHE perilesional white matter area. The arrow indicates an axon with a tightly packed, multi-layered myelin sheath (ID 43, as in b). d Higher magnification of axonal cross-sections from MOGHE lesion area (ID 7, as, in a) showing several single-layered, hypomyelinated axons (white arrow) and an axon with a loosened, or outfolding myelin sheath (black arrowhead) [14, 39]. e Samples representing perilesional areas to MOGHE (CTRL) with normal oligodendroglial cell densities, showed an average myelination of 80% (gray). MOGHE lesion areas (MOGHE) exhibited a significant decrease, with a relative share of myelinated axons of 60% (green). Each dot represents an EM frame (magnification fold: 1500x; frame area: 1mm2). f Histogram plots depict the absolute area of myelin per µm2 in MOGHE lesions (green) compared to controls (grey), measured from the digital micrograph. g G-ratio in lesional MOGHE areas showed a significant difference (p < 0.0001) when studying 100 axons from four different samples compared to their perilesional areas. The median g-ratio in lesional MOGHE areas was 0.822 compared to 0.619 in perilesional areas indicating hypomyelination. Scale bars in a-b: 5µm; Scale bars in c-d 1µm
Fig. 8
Fig. 8
BCAS1—immunoreactivity in MOGHE compared to controls. Representative images of brain samples stained with BCAS1, illustrating differences between controls (top row, a–c), MOGHESLC35A2noVar. (middle row, d–f), and MOGHE with variants (bottom row, g–i). Columns correspond to distinct age groups: 0–5 years old (first column), 15–20 years old (second column), and 25–30 years old (third column). The images revealed a significant increase in BCAS1-positive cell expression in MOGHE samples compared to controls, the latter having a consistently low BCAS1-immunolabelling. An age-dependent decrease in BCAS1-positive cells was observed in both MOGHE groups. Insets provided higher magnification views of BCAS1-positive cells. Scale bar in a: 200 μm applies to all main images and in inset, a: 10 μm, applies to all insets. Sample IDs: Panel a (CTRL. 23, male); Panel b (CTRL. 27, male); Panel c (CTRL. 28, male); Panel d (ID 31, male); Panel e (ID 2, male); Panel f (ID 22, male); Panel g (ID 54, male); Panel h (ID 36, female); Panel i (ID 32, male)
Fig. 9
Fig. 9
Age-related reduction of BCAS1-immunoreactive oligodendrocytes. a Age-related reduction of BCAS1-immunoreactive oligodendrocytes. Yellow circles: Controls including autopsies and individuals with TLE (n = 6); Blue square: Individuals with MOGHESLC35A2noVar. (n = 10); Pink Triangles: Individuals with MOGHE with missense and nonsense SLC35A2 variants (n = 12); Symbol legend applies for both panel a and b. There is a significant inverse correlation between the patient's age at epilepsy surgery and the number of BCAS1-immunoreactive cells per 1 mm2 of white matter. Pearson correlation: CTRL (r = − 0.8709; 95% confidence interval = − 0.9857 to − 0.2024; R squared = 0.7585; P (two-tailed) = 0,0009); MOGHESLC35A2noVar. (r = − 0.874; 95% confidence interval = − 0.9699 to − 0.5435; R squared = 0.7639; P (two-tailed) = 0,0239); MOGHESLC35A2Var. (r = − 0.8211; 95% confidence interval = − 0.9482 to − 0.4676; R squared = 0.6743; P (two-tailed) = 0.0011). b Age-related reduction of patchy areas of hypomyelination as indicated by Nissl-LFb staining (see also Fig. 6). Controls (n = 6); Individuals with MOGHESLC35A2noVar. (n = 8); Individuals with MOGHE with missense and nonsense SLC35A2 variants (n = 8). Nissl-LFB Hypomyelination (Y axis) indicates the relative intensity difference of each sample in Nissl-LFB staining related to the patient's age at surgery in years (X axis) in MOGHE groups and TLE individuals, and age of death for the autopsy samples included in the control group. Pearson correlation: CTRL (r = − 0.6564; 95% confidence interval = − 0.9578 to 0.3321; R squared = 0.4309, P (two-tailed) = 0.1568); MOGHESLC35A2noVar. (r = − 0.7106; 95% confidence interval = − 0.9430 to − 0.01181; R squared = 0.5049; P (two-tailed) = 0.0482); MOGHESLC35A2Var (r = − 0.7457; 95% confidence interval = − 0.9508 to − 0.08652; R squared = 0.5561; P (two-tailed) = 0.0337)
Fig. 10
Fig. 10
SLC35A2 expression in cortical vs. heterotopic neurons in MOGHE. a Cortical neuron from a control case (ID CTRL. 9). b heterotopic neuron from the white matter of a MOGHESLC35A2noVar. (ID 29). c heterotopic neuron from the white matter of a MOGHESLC35A2missense (ID 40). d The figure displays the density of neurons within the white matter (measured per mm2) across different sample groups (n = 4 for each group). In control cases, the average neuronal count is approximately 12 neurons per mm2. In contrast, MOGHE cases showed a significantly elevated density, with neuronal counts increasing up to threefold compared to controls. Scalebars—a: 5 µm b: 5 µm c:7 µm

References

    1. Aledo-Serrano A, Valls-Carbo A, Fenger CD, Groeppel G, Hartlieb T, Pascual I et al (2023) d-galactose supplementation for the treatment of mild malformation of cortical development with oligodendroglial hyperplasia in epilepsy (MOGHE): a pilot trial of precision medicine after epilepsy surgery. Neurotherapeutics 20:1294–1304. 10.1007/s13311-023-01395-z - PMC - PubMed
    1. Arizono E, Tanei ZI, Iijima K, Kimura Y, Shigemoto Y, Maki H et al (2024) MRI detection of mild malformation of cortical development with oligodendroglial hyperplasia (MOGHE) on T1WI-CHESS. Epilepsy Behav Rep 26:100674. 10.1016/j.ebr.2024.100674 - PMC - PubMed
    1. Barba C, Blumcke I, Winawer MR, Hartlieb T, Kang HC, Grisotto L et al (2023) Clinical features, neuropathology, and surgical outcome in patients with refractory epilepsy and brain somatic variants in the SLC35A2 Gene. Neurology 100:e528–e542. 10.1212/WNL.0000000000201471 - PMC - PubMed
    1. Blumcke I, Aronica E, Miyata H, Sarnat HB, Thom M, Roessler K et al (2016) International recommendation for a comprehensive neuropathologic workup of epilepsy surgery brain tissue: a consensus Task Force report from the ILAE Commission on Diagnostic Methods. Epilepsia 57:348–358. 10.1111/epi.13319 - PubMed
    1. Blumcke I, Budday S, Poduri A, Lal D, Kobow K, Baulac S (2021) Neocortical development and epilepsy: insights from focal cortical dysplasia and brain tumours. Lancet Neurol 20:943–955. 10.1016/S1474-4422(21)00265-9 - PubMed

Publication types

MeSH terms

Substances

LinkOut - more resources