. 2025 Mar 11;122(10):e2417202122.
doi: 10.1073/pnas.2417202122. Epub 2025 Mar 5.

Core dimensions of human material perception

Affiliations

Core dimensions of human material perception

Filipp Schmidt et al. Proc Natl Acad Sci U S A. .

Abstract

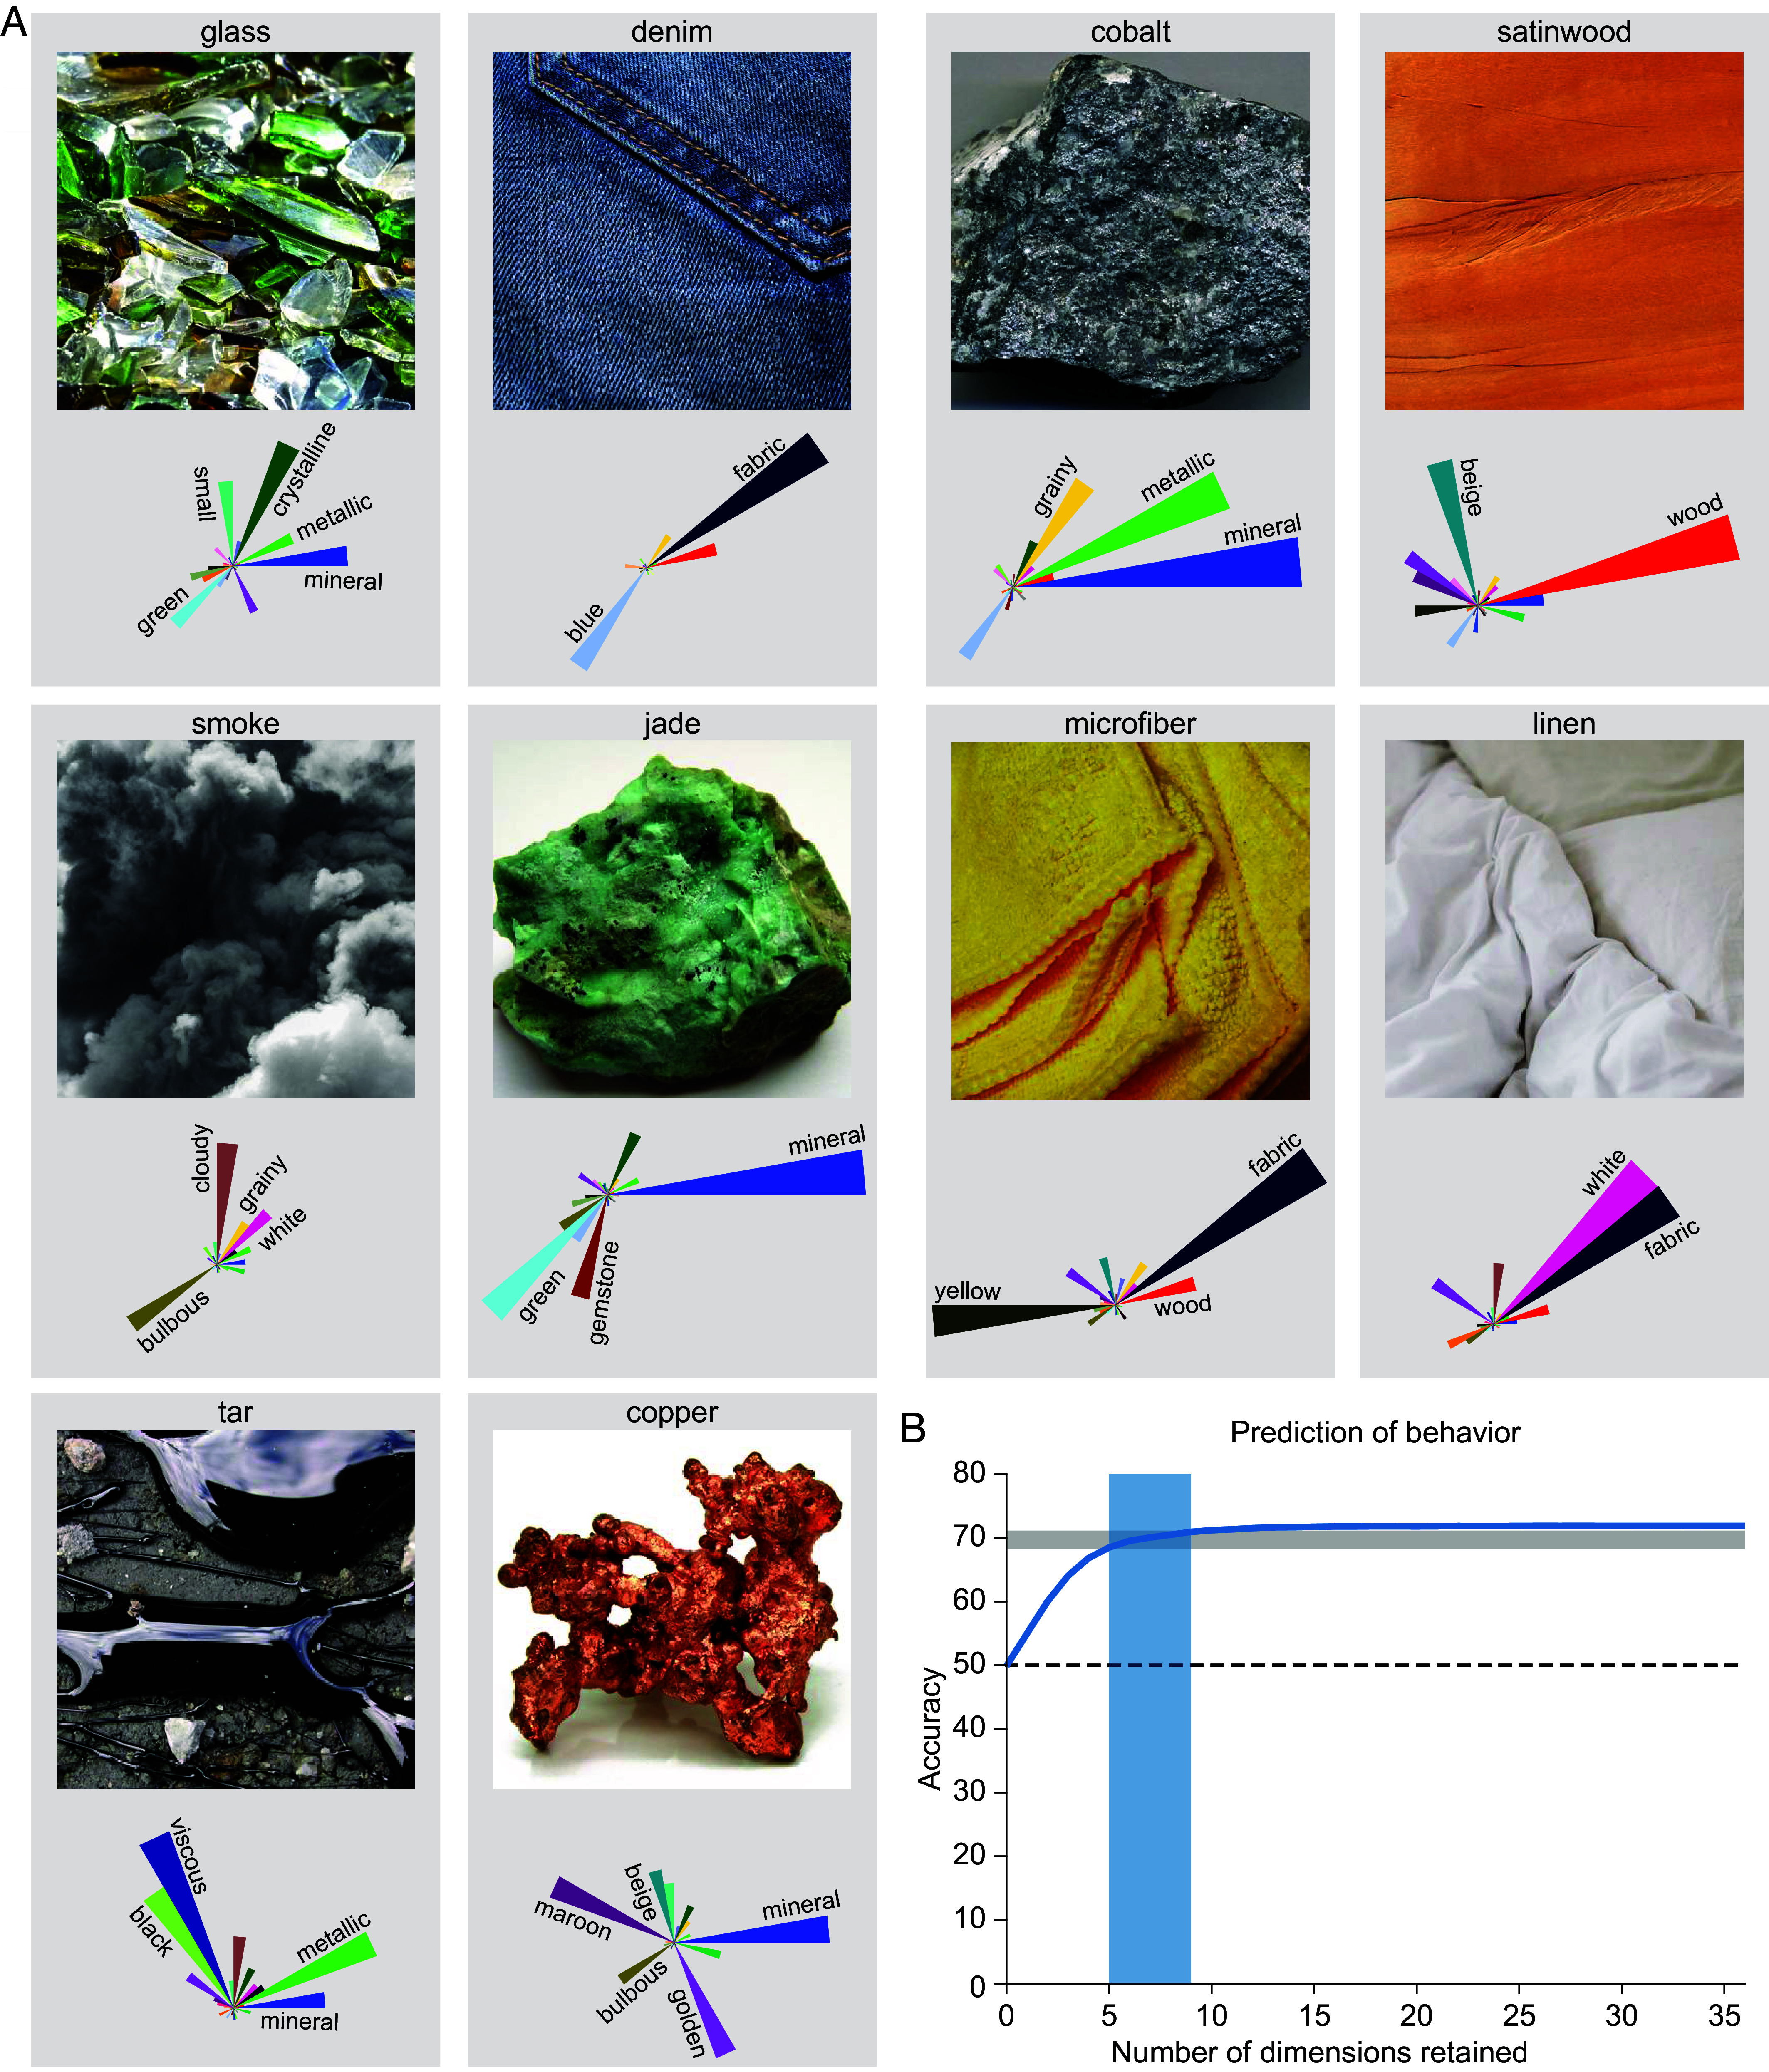
Visually categorizing and comparing materials is crucial for everyday behavior, but what organizational principles underlie our mental representation of materials? Here, we used a large-scale data-driven approach to uncover core latent dimensions of material representations from behavior. First, we created an image dataset of 200 systematically sampled materials and 600 photographs (STUFF dataset, https://osf.io/myutc/). Using these images, we next collected 1.87 million triplet similarity judgments and used a computational model to derive a set of sparse, positive dimensions underlying these judgments. The resulting multidimensional embedding space predicted independent material similarity judgments and the similarity matrix of all images close to the human intersubject consistency. We found that representations of individual images were captured by a combination of 36 material dimensions that were highly reproducible and interpretable, comprising perceptual (e.g., grainy, blue) as well as conceptual (e.g., mineral, viscous) dimensions. These results provide the foundation for a comprehensive understanding of how humans make sense of materials.

Keywords: categorization; computational model; feature space; material perception; vision.


Conflict of interest statement

Competing interests statement:The authors declare no competing interest.

Figures

Fig. 1.
Fig. 1.
STUFF dataset. (A) Hierarchical clustering of all 200 material concepts based on an off-the-shelf semantic embedding for material nouns (11), illustrating the scope of our dataset. An approximate assignment of materials to the 10 superclasses of the Flickr Material Database (6) is shown below the dendrogram. (B) Examples from the 600 images of our STUFF dataset (https://osf.io/myutc/) (12), which contains 3 images per each of the 200 material classes; images from the same class are grouped by green frames. Copyright information for all images is provided in SI Appendix, Table S2.
Fig. 2.
Fig. 2.
Experimental paradigm and modeling. (A) Illustration of the triplet 2-AFC task. Material images were presented to participants in different contexts imposed by the third material in a triplet. We used online crowdsourcing to sample across a wide range of these random contexts. (B) The goal of the modeling procedure was to learn a representational embedding (28) that i) captures choice behavior in the triplet 2-AFC task, ii) predicts similarity across all pairs of materials, and iii) provides interpretable material dimensions. Since only a subset of all possible triplets had been sampled, the model also served to estimate the complete similarity matrix. Copyright information for all images is provided in SI Appendix, Table S2.
Fig. 3.
Fig. 3.
Modeling results and interpretability of model dimensions. (A) Model prediction performance for individual trials in independent test data, relative to chance (gray) and the human intersubject consistency (green). The intersubject consistency denotes maximal performance given the between-participant variation which is due to noise or true differences between participants and is obtained by calculating the consistency in participants’ responses to the same triplet. The model reached 91.7% of the intersubject consistency. Error bar for prediction and width of intersubject consistency bar denote 95% CI. (B) To estimate how well the model predicted behavioral similarity, we compared a fully sampled behavioral similarity matrix for a subset of 60 images (blue) to the model-generated similarity matrix for these images (green). (C) The close fit between both shows that most explainable variance was captured by the model embedding (Pearson’s r = 0.90; P < 0.001; randomization test; 95% CI, 0.88 to 0.91). (D) Visualization of four example dimensions and associated results of the dimension-labeling experiment. The example dimensions are visualized showing six images with large embedding weights in these dimensions. The word clouds reflect a summary of the semantic labels provided by participants for these dimensions (here only showing labels mentioned more than once; for the complete word clouds for all dimensions see SI Appendix, Fig. S4). Copyright information for all images is provided in SI Appendix, Table S2. (E) The most frequent labels provided for each dimension, with dimensions 1 to 36 ordered according to their sparsity (i.e., mineral showed the lowest sparsity with almost all of our 600 images having nonzero values; turquoise color showed the highest sparsity with only a few images having nonzero values).
Fig. 4.
Fig. 4.
Similarity between model dimensions and expansion in material similarity space. (A) Clustering of 36 model dimensions based on the pairwise distances between their values across all 600 materials, together with the correlation matrix, showing mostly low to moderate correlations between dimensions (mean correlation r = −0.01, SD = 0.12, range = −0.51 to 0.37). (B) The distribution of weights for four example dimensions across all 600 images, visualized by plotting images as points in a two-dimensional t-SNE visualization of the similarity embedding (initialized with multidimensional scaling; dual perplexity, 5 and 30; 1,000 iterations). Color represents how strongly each image expressed the particular dimension (normalized to range 0 to 1: blue–red).
Fig. 5.
Fig. 5.
Behavioral judgments and similarity for individual images are well explained by 5 to 9 dimensions. (A) Example material images and corresponding distributions across dimensions, using rose plots with each petal reflecting the degree a material dimension is expressed for that image. Petal orientation and colors indicate individual dimensions and length indicates the value in that dimension. Dimension labels are only provided for weights > 0.53. Copyright information for all images is provided in SI Appendix, Table S2. (B) For explaining 95 to 99% of the predictive performance in behavior, only 5 to 9 dimensions per image are required; however, these dimensions varied between images (see main text for details).
Fig. 6.
Fig. 6.
Two-dimensional visualization of the similarity embedding. The similarity embedding is visualized by combining rose plots for each material with t-SNE dimensionality reduction (initialized by multidimensional scaling; dual perplexity, 5 and 30; 1,000 iterations). Frames of example images are colored according to the dominant dimension, but note that multiple other dimensions also play a role for each stimulus. Copyright information for all images is provided in SI Appendix, Table S2.

Similar articles

Cited by

References

    1. Kietzmann T. C., et al. , Recurrence is required to capture the representational dynamics of the human visual system. Proc. Natl. Acad. Sci. U.S.A. 116, 21854–21863 (2019), 10.1073/pnas.1905544116. - DOI - PMC - PubMed
    1. Bracci S., Ritchie J. B., op de Beeck H., On the partnership between neural representations of object categories and visual features in the ventral visual pathway. Neuropsychologia 105, 153–164 (2017), 10.1016/j.neuropsychologia.2017.06.010. - DOI - PMC - PubMed
    1. Jozwik K. M., Kriegeskorte N., Mur M., Visual Features as Stepping Stones Toward Semantics: Explaining Object Similarity in IT and Perception with Non-Negative Least Squares (Cold Spring Harbor Laboratory, 2015). - PMC - PubMed
    1. Cichy R. M., et al. , The spatiotemporal neural dynamics underlying perceived similarity for real-world objects. NeuroImage 194, 12–24 (2019), 10.1016/j.neuroimage.2019.03.031. - DOI - PMC - PubMed
    1. Wiebel C. B., Valsecchi M., Gegenfurtner K. R., The speed and accuracy of material recognition in natural images. Atten. Percept. Psychophys. 75, 954–966 (2013), 10.3758/s13414-013-0436-y. - DOI - PubMed

LinkOut - more resources