. 2025 Mar 18;19(10):10312-10322.
doi: 10.1021/acsnano.4c18013. Epub 2025 Mar 5.

Direct Observation of Phase Change Accommodating Hydrogen Uptake in Bimetallic Nanoparticles

Affiliations

Direct Observation of Phase Change Accommodating Hydrogen Uptake in Bimetallic Nanoparticles

Lívia P Matte et al. ACS Nano. .

Abstract

Hydrogen holds great promise as a cleaner alternative to fossil fuels, but its efficient and affordable storage remains a significant challenge. Bimetallic systems, such as Pd and Ni, present a promising option for storing hydrogen. In this study, using the combination of different cutting-edge X-ray and electron techniques, we observed the transformations of Pd-Ni nanoparticles, which initially consist of a NiO-rich shell surrounding a Pd-rich core but undergo a major transformation when they interact with hydrogen. During hydrogen exposure, the Pd core breaks into smaller pockets, dramatically increasing its surface area and enhancing the hydrogen storage capacity, especially in nanoparticles with lower Pd content. The findings provide a deep understanding of the morphological changes at the atomic level during hydrogen storage and contribute to designing cost-effective hydrogen storage using multimetallic systems.

Keywords: bimetallic nanoparticles; core−shell structure; hydrogen storage; in situ measurements; morphology changes.


Conflict of interest statement

The authors declare no competing financial interest.

Figures

Figure 1
Figure 1
(a) Typical HAADF-STEM image of the Pd25Ni75 sample. (b) XRD measurements of the PdxNi100–x samples. The points represent the experimental data, and the gray line represents the fit obtained from the Rietveld refinement. The blue triangle, red star, and gray circle show the position of the Bragg reflections related to the NiO, PdO, and Pd(0) crystalline phases, respectively. (c) Pd(0) fraction as a function of time obtained from in situ XANES measurements during the 30 mL/min 4% H2 + 96% He exposure at room temperature and (d) on the nanoparticles’ surface obtained from the XPS measurements under UHV as a function of temperature.
Figure 2
Figure 2
Fourier Transform of the EXAFS oscillations at the (a) Pd K edge and (b) Ni K edge during H2 exposure at RT and atmospheric pressure. The black dots represent the data measured, and the pink line represents the fit performed. (c) Increase of the Pd–Pd atomic distance in comparison to Pd standard position as a function of Pd content in the nanoparticles.
Figure 3
Figure 3
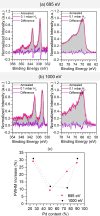
Typical AP-XPS measurements of the Pd25Ni75 nanoparticles in the Pd 3d and Ni 3p energy regions using a photon energy of (a) 695 eV and (b) 1000 eV. The gray and pink lines represent the measurement after annealing under UHV and during 0.1 mbar H2 exposure for 2 h at RT, respectively. The difference between the spectrum during the H2 exposure process and the spectrum measured after annealing is presented below each spectrum in purple. (c) Relative increase in the fwhm of the peak related to Pd(0) when comparing the Pd 3d spectra after annealing and during H2 exposure as a function of Pd content in the nanoparticles.
Figure 4
Figure 4
(a) Typical AP-GIXS measurement of the as-prepared Pd25Ni75 nanoparticles. The red straight line represents the position of the cut used in the analysis. (b) Pair distance distribution function (PDDF) obtained from the inverse Fourier transform of the cut presented in (A) for the Pd25Ni75 as prepared, annealed, and under a 0.1 mbar H2 atmosphere, presented in black, gray, and magenta, respectively. (c) Radius of gyration as a function of the treatment applied. On the bottom, reconstruction of the electronic density inside the Pd25Ni75 nanoparticles for the (d) as prepared, (e) annealed, and (f) under 0.1 mbar H2 atmosphere. In red is presented the region with higher electronic density, yellow is the region with medium electronic density, and blue is the region with lower electronic density.
Figure 5
Figure 5
Reconstruction of the electronic density under 0.1 mbar H2 atmosphere for (a) Pd25Ni75, (b) Pd50Ni50, and (c) Pd75Ni25. In red is presented the region with higher electronic density, yellow, medium electronic density, and blue, lower electronic density. (d) Relative increase in particle mean diameter, calculated from the smallest particle enclosing sphere to account for the changes in shape and surface roughness during H2 treatment. (e) Relative expansion of the fractal enclosing sphere used to define the outer boundaries of the high density Pd core before and during H2 treatment in percent. (f) Relative increase in the fwhm value of the curve relative to the electronic density distribution inside the nanoparticles.
Figure 6
Figure 6
(a) STEM-HAADF image of a typical as prepared Pd25Ni75 nanoparticle from which (b) the Ni compositional map was obtained by integration of the L edge and (c) the Pd compositional map was obtained by integration of the M edge. (d) A composite map overlapping the Ni (green) and Pd (magenta) maps. The color bars in these images show the atomic percentage which is calculated based on all the available elements in the spectral window from 230 to 1419.3 eV, which includes both C K-edge (∼284 eV) and O K-edge (∼532 eV).

References

    1. Karpa W.; Grginović A. (Not so) Stranded: The Case of Coal in Poland. Energies 2021, 14, 8476.10.3390/en14248476. - DOI
    1. Mazloomi K.; Gomes C. Hydrogen as an Energy Carrier: Prospects and Challenges. Renew. Sustain. Energy Rev. 2012, 16, 3024–3033. 10.1016/j.rser.2012.02.028. - DOI
    1. DOE Technical Targets for Onboard Hydrogen Storage for Light-Duty Vehicles. https://www.energy.gov/eere/fuelcells/doe-technical-targets-onboard-hydr... (accessed February 21st, 2025), 2017.
    1. Usman M. R. Hydrogen Storage Methods: Review and Current Status. Renew. Sustain. Energy Rev. 2022, 167, 11274310.1016/j.rser.2022.112743. - DOI
    1. Jena P. Materials for Hydrogen Storage: Past, Present, and Future. J. Phys. Chem. Lett. 2011, 2, 206–211. 10.1021/jz1015372. - DOI