Single-Cell Analyses Reveal a Functionally Heterogeneous Exhausted CD8+ T-cell Subpopulation That Is Correlated with Response to Checkpoint Therapy in Melanoma
- PMID: 40042995
- PMCID: PMC12356630
- DOI: 10.1158/0008-5472.CAN-23-3918
Single-Cell Analyses Reveal a Functionally Heterogeneous Exhausted CD8+ T-cell Subpopulation That Is Correlated with Response to Checkpoint Therapy in Melanoma
Abstract
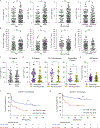
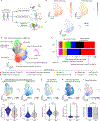
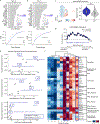
PD-1 pathway inhibitors have revolutionized cancer therapy. However, most patients do not durably benefit, highlighting the need for biomarkers to stratify patients as responders or nonresponders. Although CD8+ tumor-infiltrating lymphocytes (TIL) have been associated with immune checkpoint therapy response, there is no consensus on which CD8+ TIL subpopulations have the most prognostic value. Preclinical studies have focused on progenitor-like exhausted CD8+ T cells (TPEX) because TPEX proliferate more in response to PD-1 inhibitors than other exhausted T-cell (TEX) subpopulations. However, immune checkpoint inhibitor treatment drives TPEX differentiation into other TEX populations that can mediate antitumor immunity. These data complicate the ability to identify prognostically important T-cell populations in patients that predict immune checkpoint inhibitor treatment response. In this study, we found that patients with advanced melanoma with ≥20% of CD8+ TILs coexpressing PD-1 and CTLA4 (termed CPHi TIL) had better objective response rates and survival following PD-1 monotherapy than those below this threshold. Characterization of the CPHi TIL subset using bulk and single-cell RNA sequencing showed that although TPEX-like cells were present within the CPHi subset, they were in the minority of these cells. Rather, the CPHi population was numerically dominated by other subsets, including cycling, terminally exhausted-like, cytotoxic-like, and/or resident memory-like TEX populations, and a subset enriched for glycolytic genes. Collectively, these data show that CPHi TILs correlate with response in melanoma, but this TIL subset is a heterogeneous mix of different subpopulations that may differentially contribute to antitumor immunity following checkpoint blockade. Significance: The PD-1+ CTLA4+ CD8+ tumor-infiltrating lymphocyte population correlating with immunotherapy response is a heterogeneous mix of subpopulations, which has important implications for optimizing checkpoint-based immunotherapy.
©2025 American Association for Cancer Research.
Conflict of interest statement
L.A.H. is an advisory/aboard for Pfizer and AstraZeneca. L.A.H. Also receives book royalties from McGraw Hill, Inc.
L.S.L was previously employed at Lyell Immunopharma.
A.H.S. has patents/pending royalties on the PD-1 pathway from Roche and Novartis and has research funding from AbbVie, Taiwan Bio and Calico unrelated to the submitted work. A.H.S. serves on advisory boards for Elpiscience, Monopteros, Bioentre, Corner Therapeutics, and Alixia. A.H.S. also is on scientific advisory boards for the Massachusetts General Cancer Center, Program in Cellular and Molecular Medicine at Boston Children’s Hospital, the Human Oncology and Pathogenesis Program at Memorial Sloan Kettering Cancer Center, the Johns Hopkins Bloomberg Kimmel Institute for Cancer Immunotherapy, the Gladstone Institute, Perlmutter Cancer Center at New York University, GlaxoSmithKline, Amgen, and Janssen. A.H.S. is an academic editor for the Journal of Experimental Medicine.
M.D.R. is a consultant and confounder of TRex Bio., Sitryx Bio., and Radera Bio.
K.E.P. has a patent pending that is unrelated to the current work on T cell state-specific regulators of T cell exhaustion. KEP reports an advising relationship with Guardant Health that may result in advising fees.
A.I.D. has stock or other ownership interests in Neuvogen and Trex Bio; receives Honoraria from EMD Serono and Inovio Pharmaceuticals; has consulting or advisory roles at Genoptix, GlaxoSmithKline, OncoSec, Caris, Eisai, and GLG; receives research funding from Bristol-Myers Squibb, Checkmate Pharmaceuticals, Genentech/Roche, GlaxoSmithKline, Incyte, Merck/Schering Plough, Novartis, Oncosec, and Pfizer; has a patent relating to testing for immunotherapy.
Figures


References
-
- Sharma P, et al. , Immune checkpoint therapy-current perspectives and future directions. Cell, 2023. 186(8): p. 1652–1669. - PubMed
-
- Sharma P, et al. , The Next Decade of Immune Checkpoint Therapy. Cancer Discov, 2021. 11(4): p. 838–857. - PubMed
-
- Zeidan AM, Komrokji RS, and Brunner AM, TIM-3 pathway dysregulation and targeting in cancer. Expert Rev Anticancer Ther, 2021. 21(5): p. 523–534. - PubMed
MeSH terms
Substances
Grants and funding
- P01 AI056299/AI/NIAID NIH HHS/United States
- R01 AR071944/AR/NIAMS NIH HHS/United States
- P50 CA221703/CA/NCI NIH HHS/United States
- R01 AR077553/AR/NIAMS NIH HHS/United States
- 7K08CA256044-3/National Institutes of Health (NIH)
- T32 DK007573/DK/NIDDK NIH HHS/United States
- P30 DK063720/DK/NIDDK NIH HHS/United States
- P01 CA236749/CA/NCI NIH HHS/United States
- P50CA221703/National Cancer Institute (NCI)
- S10 OD021822/OD/NIH HHS/United States
- K08 CA256044/CA/NCI NIH HHS/United States
- P01 AI039671/AI/NIAID NIH HHS/United States
- P01AI039671/National Institutes of Health (NIH)
- 5T32DK007573/National Institutes of Health (NIH)
- P01 AI108545/AI/NIAID NIH HHS/United States
LinkOut - more resources
Full Text Sources
Medical
Research Materials

