. 2025 Mar 7;11(10):eadr9395.
doi: 10.1126/sciadv.adr9395. Epub 2025 Mar 5.

GPR132 regulates the function of NK cells through the Gαs/CSK/ZAP70/NF-κB signaling pathway as a potential immune checkpoint

Affiliations

GPR132 regulates the function of NK cells through the Gαs/CSK/ZAP70/NF-κB signaling pathway as a potential immune checkpoint

Xinhui Hui et al. Sci Adv. .

Abstract

As a member of the proton-sensing GPCR receptors, GPR132 plays a crucial role in regulating immune cell functions, but the mechanism by which GPR132 affects natural killer (NK) cells has not yet been reported. Here, RNA-seq displayed that the expression of GPR132 was reduced in activated NK cells, and the proportion of mature NK cells in GPR132-/- mice was substantially increased compared to WT mice, with stronger anti-melanoma capabilities. Further investigation indicates that GPR132-deficient NK92 cells expressed more GzmB and IFN-γ and exhibited stronger cytotoxicity. Mechanically, GPR132 regulates NK cell function through the CSK/ZAP70/NF-κB signaling axis. Down-regulation of GPR132 weakens the inhibition of NK cell function by lactate, thereby enhancing the functional execution of CAR-NK cells against colorectal cancer. These results highlight the previously unrecognized role of GPR132 in the regulation of NK cell function and that inhibition of GPR132 provided an updated insight for NK cell therapy.


Figures

Fig. 1.
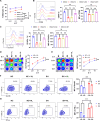
Fig. 1.. The expression of GPR132 decreased in activated NK cells.
(A to C) RNA-seq analysis of gene expression in activated NK cells compared with a control group (n = 3). (A) Heatmap shows the expression variation of NK activation–related markers and inhibition of NK activation markers. (B) Volcano plot shows 3446 genes shared by three donors. Down-regulated genes, blue; up-regulated genes, yellow; interested genes, red. (C) Column chart shows the expression of the interested GPCR gene according to FPKM value. (D) RT-PCR to detect the GPR132 expression in NK92 cells after being stimulated by ionomycin (1 μg/ml) and PMA (20 ng/ml) at 0, 6, or 12 hours. β-Actin was used as a reference housekeeping gene (n = 3, biological replicates). (E) WB determined the GPR132 expression in NK92 cells after being stimulated by ionomycin (1 μg/ml) and PMA (20 ng/ml) for 12 hours. β-Tubulin was used as a reference housekeeping gene. Data represent means ± SD. Analyzed by two-way analysis of variance (ANOVA), one-way ANOVA, or unpaired t test (*P < 0.05, **P < 0.01, ***P < 0.001, and ****P < 0.0001).
Fig. 2.
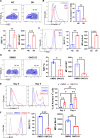
Fig. 2.. Knockout of GPR132 enhanced the ability of NK cells to resist melanoma.
(A and B) FACS analysis of the NK cells (A) and CD27CD11b+ NK cells (B) percentage in the spleen (n = 4). The representative FACS profile is on the left, and the column chart is on the right. (C) Tumor volume was measured every 2 days, and growth curves were shown (n = 5). (D) Kaplan-Meier survival curve visually depicted the overall survival rate for WT and GPR132−/− mice in a 50-day survival study (n = 10). (E to I) Melanomas were divested when the tumor volume reached 1500 to 2000 mm3, the tumors were photographed (E) and weighted (F) (n = 5), then the proportion of NK cells inside the tumors (G) and the expression of GzmB (H) and IFN-γ (I) in tumor-infiltrating NK cells (n = 3) were analyzed by FACS. (J) FACS analysis of the NK cell proportion in the peripheral blood of recipients after receiving WT and GPR132−/− bone marrow cells for 4 weeks. (K) Schematic diagram of melanoma lung metastasis experiment. On day 0, 3 × 10⁵ B16-F10 cells were injected into per mouse via the tail vein. (L) On day 10, FACS analysis was performed to determine the NK cell depletion in the peripheral blood of anti-NK1.1 or PBS-treated mice. On day 14, the melanoma colony numbers were counted in the lungs and the weight of the lungs was measured (n = 3). (M to O) Photographs of lungs from the PBS and anti-NK1.1–treated group are shown at the top (M), and the statistical charts [(N) and (O)] are shown at the bottom. Data are shown as means ± SD and were analyzed by unpaired t test or log-rank test (*P < 0.05, **P < 0.01, ***P < 0.001, and ****P < 0.0001; ns, not significant).
Fig. 3.
Fig. 3.. Deficiency of GPR132 improves the cytotoxicity of NK cells.
(A) The line plots displayed the killing ability of WT and GPR132−/− mice splenic NK cells against Yac-1 cells for 4 hours. The E:T ratios are 5:1, 10:1, and 20:1. (B to D) FACS analysis of CD107a, GzmB, and IFN-γ expression in splenic NK cells of WT and GPR132−/− mice after coculture with target cells at a 10:1 ratio for 4 hours. (E) NK92 cells were infected with Mock, shNC, and shRNA lentivirus for 48 hours and then collected to perform an RT-PCR analysis to verify the interference efficiency of GPR132. The multiplicity of infection (MOI) is 10. (F) Line plots illustrate the killing ability of NK92 cells against K562 cells at various E:T ratios over a 4-hour duration. NC was the NK92 cells infected with shRNA-NC lentivirus, and SH was the NK92 cells infected with GPR132-shRNA2 lentivirus at MOI = 10. (G to J) After coculture with K562 cells at a 5:1 (E:T) ratio for 4 hours, FACS was conducted to detect the expression of CD69 (G), CD107a (H), IFN-γ (I), and GzmB (J). For (H) and (J), the representative FACS histogram is displayed on the left, and the column chart is on the right. The experiment was performed at least three times. Data are shown as means ± SD. Analyzed by unpaired t test or one-way ANOVA (*P < 0.05, **P < 0.01, ***P < 0.001, and ****P < 0.0001). MFI, mean fluorescence intensity.
Fig. 4.
Fig. 4.. Activation of GPR132 inhibits the function of NK92 cells.
(A) NK92 cells, NC-NK92 cells, and SH-NK92 cells were treated with DMSO or 5 μM ONC212 for 12 hours and cocultured with K562 cells at various E:T ratios for 4 hours to detect cytotoxicity. (B and C) Expression of CD107a and GzmB in the indicated group was analyzed by flow cytometry after coculture with K562 cells at a 5:1 (E:T) ratio for 4 hours. The representative FACS histogram is displayed on the left, and the column charts are on the right. (D and E) Lysis rate of HCT116-luciferase cells (D) and MGC803-luciferase cells (E) was detected by bioluminescence imaging after 4 hours cocultured with indicated NK92 group at different E:T ratios. NC + HL and SH + HL mean NK92 cells were treated with 10 mM lactate acid for 12 hours, with untreated NC-NK92 and SH NK92 cells as a control. (F and G) NC-NK92 and SH-NK92 cells were treated with or without 10 mM lactate for 12 hours and cocultured with HCT116 at a 5:1 (E:T) ratio for 4 hours, and subsequently, the expression of GzmB (F) and IFN-γ (G) were analyzed by flow cytometry. The representative FACS profile is displayed on the left, and the MFI column is on the right. Data are shown as means ± SD, and the experiment was performed three times. The experiment was performed three times. Data are shown as means ± SD. Analyzed by one-way ANOVA, unpaired t test, or two-way ANOVA (*P < 0.05, **P < 0.01, and ***P < 0.001).
Fig. 5.
Fig. 5.. GPR132 affects the proliferation and apoptosis of NK92 cells.
(A to C) NK92 cells were infected with shRNA-NC or shRNA-GPR132 lentivirus for 48 hours at MOI = 10 and cultured for 3 to 5 days. On day 5, the cells were collected to analyze Ki67 expression (A), and on day 4, annexin V+ cell proportion (B) and Bcl-2 expression (C) were analyzed by flow cytometry. (D to F) NK92 cells were treated with DMSO or ONC212 (5 μM) for 12 hours and cultured for continuous 2 to 5 days. FACS analysis was performed for Ki67 expression (D) on day 5, annexin V+ cell percentage (E) on days 2 and 4, and Bcl-2 expression (F) on day 4. For analysis of annexin V+ rate and Bcl-2 expression, NK92 cells were cultured without supplemented hIL-2. For (A), the representative FACS profile is shown at the top, and the column charts are at the bottom. For (B) to (F), the representative FACS histogram (left) and the column chart (right) are shown. The experiment was performed three times. Data are shown as means ± SD. Analyzed by unpaired t test or two-way ANOVA (*P < 0.05, **P < 0.01, ***P < 0.001, and ****P < 0.0001).
Fig. 6.
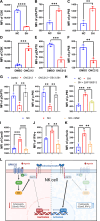
Fig. 6.. GPR132 inhibits the function of NK cells via the Gαs/CSK/ZAP70/NF-κB signal axis.
(A to C) FACS analysis of the CSK, pZAP70, and p-P65 expression in NC-NK92 and SH-NK92 cells. (D and F) FACS analysis of the CSK, pZAP70, and p-P65 expression in DMSO-NK92 and ONC212-NK92 cells. CSK was stained by primary antibody at 4°C for 30 min and then stained with AF647 anti-rabbit IgG antibody. (G) DMSO-NK92 and ONC212-NK92 cells were treated with DMSO or 10 μM DB-3-291 (CSK degrader) to analyze the expression of pZAP70 and p-P65 by flow cytometry. (H) NC-NK92 and SH-NK92 cells were treated with DMSO or 5 μM ZAP180013 (ZAP70 inhibitor) to detect the expression of p-P65 by flow cytometry. (I to K) NC-NK92 and SH-NK92 cells were treated with DMSO or 5 μM QNZ (NF-κB inhibitor) to detect the expression of GzmB, IFN-γ, and perforin by flow cytometry. (L) Graphical abstract shows the summary of the signaling mechanism. The experiment was performed three times. Data are shown as means ± SD. Analyzed by unpaired t test or one-way ANOVA (*P < 0.05, **P < 0.01, ***P < 0.001, and ****P < 0.0001).
Fig. 7.
Fig. 7.. Down-regulation of GPR132 promotes the antitumor activity of CAR-NK92 cells in vitro.
To prepare CAR-NK92 cells, 5 × 10⁵ NK92 cells were transduced with mock, CAR, NC-CAR, and SH-CAR lentiviruses, respectively, at MOI = 10. (A and B) Line plots displayed the killing ability of mock-NK92 cells, CAR-NK92 cells, NC-CAR-NK92 cells, and SH-CAR-NK92 cells against HCT116 cells and HCT15 cells at 2.5:1, 5:1, and 10:1 (E:T) ratios for 4 hours. (C and D) Expression of CD69 and CD107a in the indicated group was performed by flow cytometry after coculture with HCT116 cells at a 5:1 ratio for 4 hours. The representative FACS histogram (left) and the MFI column chart (right) are displayed. (E and F) FACS analysis of GzmB and IFN-γ expression in indicated groups after co-culture with HCT116 cells at a 5:1 ratio for 4 hours. The representative FACS profile is shown on the left, and the MFI column chart is on the right. The experiment was performed three times. Data are shown as means ± SD. Analyzed by one-way ANOVA (*P < 0.05, **P < 0.01, ***P < 0.001, and ****P < 0.0001).
Fig. 8.
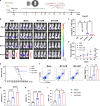
Fig. 8.. Down-regulation of GPR132 enhances the antitumor ability of CAR-NK92 cells in vivo.
(A) Schematic representation of the animal experimental design. (B) IVIS was used to assess the progression of HCT116-luciferase tumors in each group on days 0, 13, 19, and 27 (n = 4). (C) On day 27, the total bioluminescence flux (photons per second) emitted by tumors of the remaining mice in each group was quantified through IVIS. (D) Tumor volume was regularly assessed using calipers and presented with line plots (n = 4). (E) Overall survival rate for mice in each experimental group was depicted by the Kaplan-Meier survival curve (n = 8). (F) FACS analysis of the proportion of NK cells (CD45+CD56+) inside the tumor (n = 3). The representative FACS profile is shown on the left, and the column chart is on the right. (G to I) Expression of CD107a, GzmB, and IFN-γ in tumor CD45+CD56+ cells was determined by FACS (n = 3). Data are shown as means ± SD and were analyzed by one-way ANOVA (*P < 0.05, **P < 0.01, ***P < 0.001, and ****P < 0.0001).

References

    1. Dorsam R. T., Gutkind J. S., G-protein-coupled receptors and cancer. Nat. Rev. Cancer 7, 79–94 (2007). - PubMed
    1. Hilger D., Masureel M., Kobilka B. K., Structure and dynamics of GPCR signaling complexes. Nat. Struct. Mol. Biol. 25, 4–12 (2018). - PMC - PubMed
    1. Weis W. I., Kobilka B. K., The molecular basis of G protein-coupled receptor activation. Annu. Rev. Biochem. 87, 897–919 (2018). - PMC - PubMed
    1. Hauser A. S., Attwood M. M., Rask-Andersen M., Schiöth H. B., Gloriam D. E., Trends in GPCR drug discovery: New agents, targets and indications. Nat. Rev. Drug Discov. 16, 829–842 (2017). - PMC - PubMed
    1. Insel P. A., Sriram K., Salmerón C., Wiley S. Z., Proton-sensing G protein-coupled receptors: Detectors of tumor acidosis and candidate drug targets. Future Med. Chem. 12, 523–532 (2020). - PMC - PubMed