. 2025 Mar 7;11(10):eadq8538.
doi: 10.1126/sciadv.adq8538. Epub 2025 Mar 5.

Immunomodulatory role of the stem cell circadian clock in muscle repair

Affiliations

Immunomodulatory role of the stem cell circadian clock in muscle repair

Pei Zhu et al. Sci Adv. .

Abstract

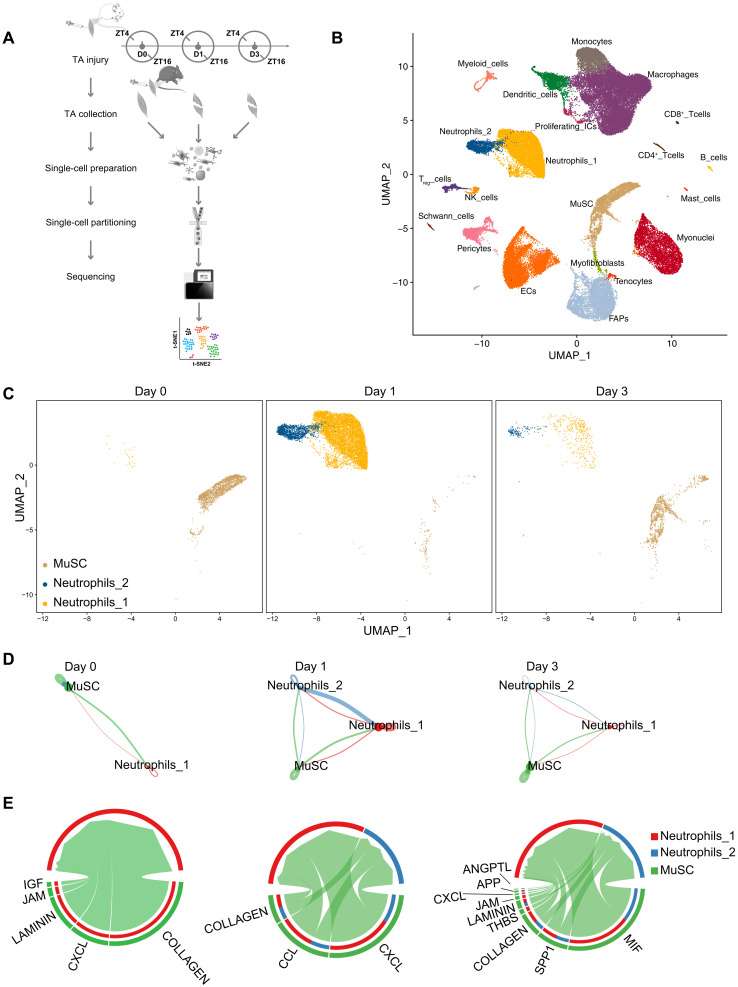
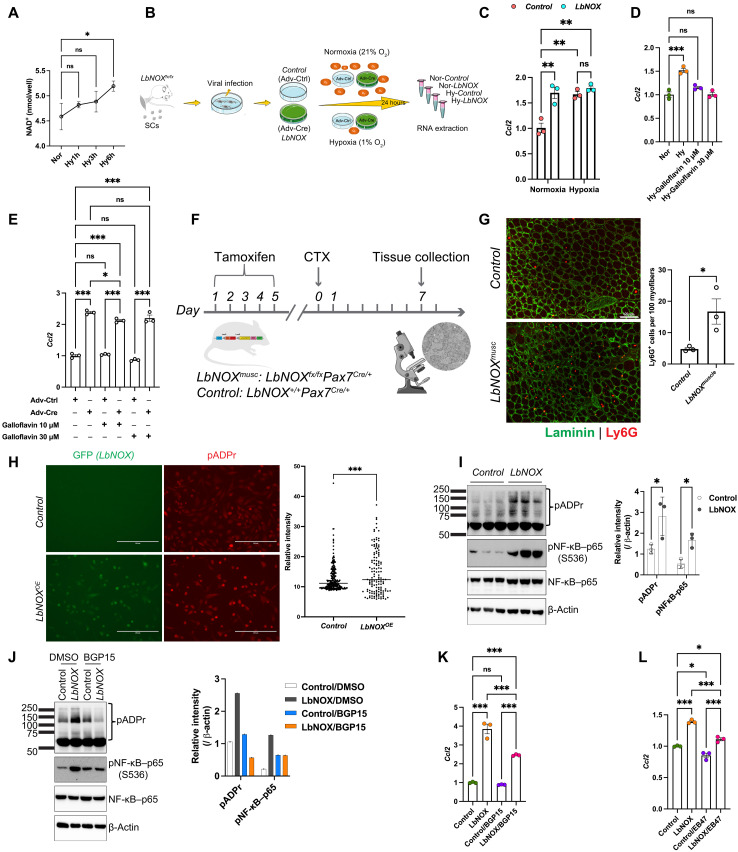
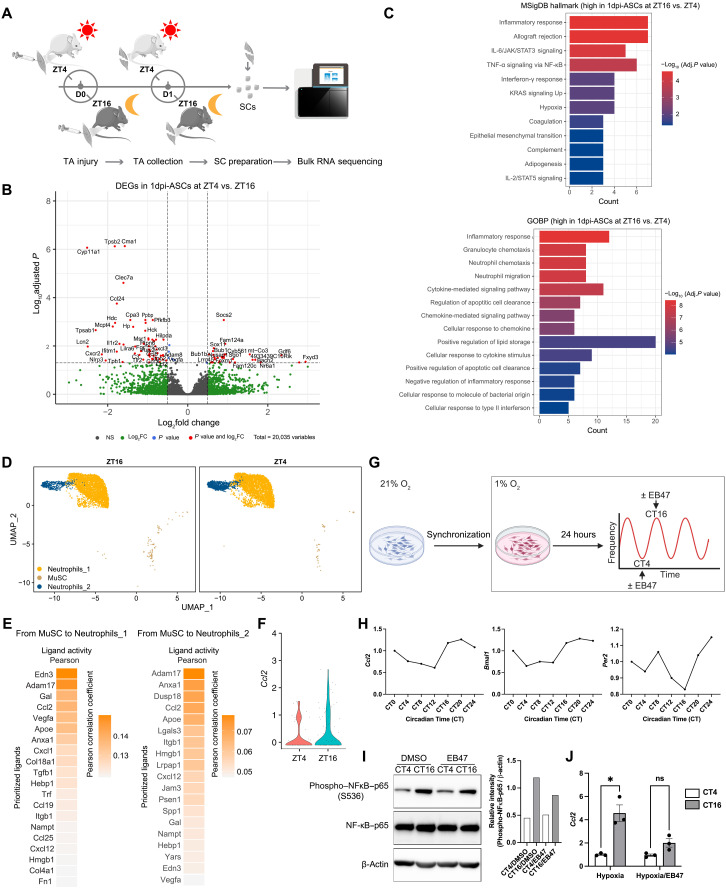
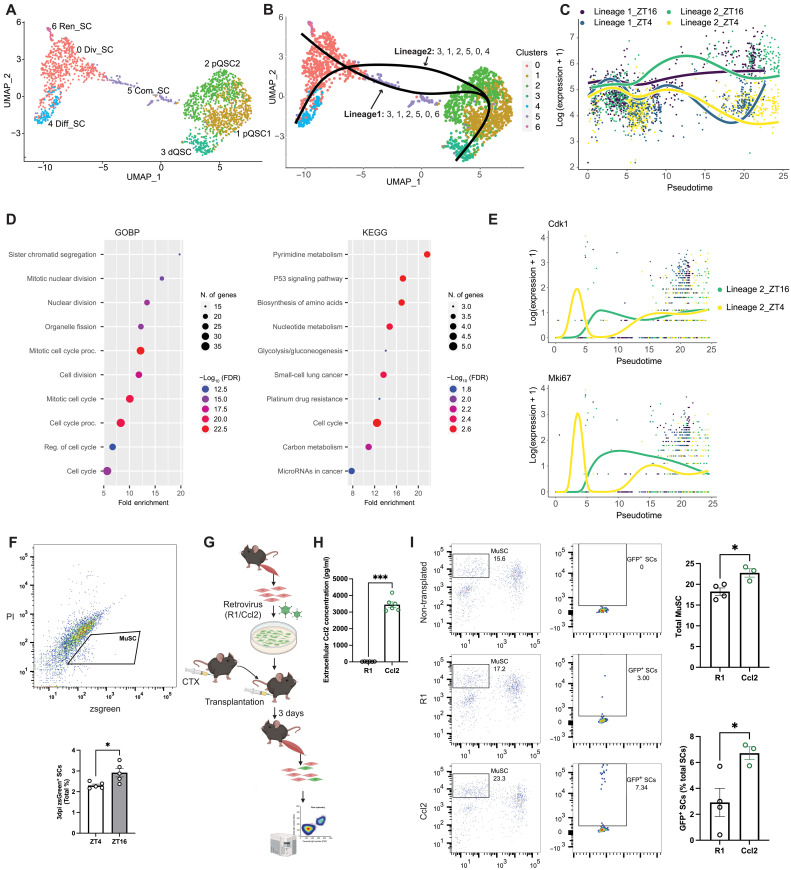
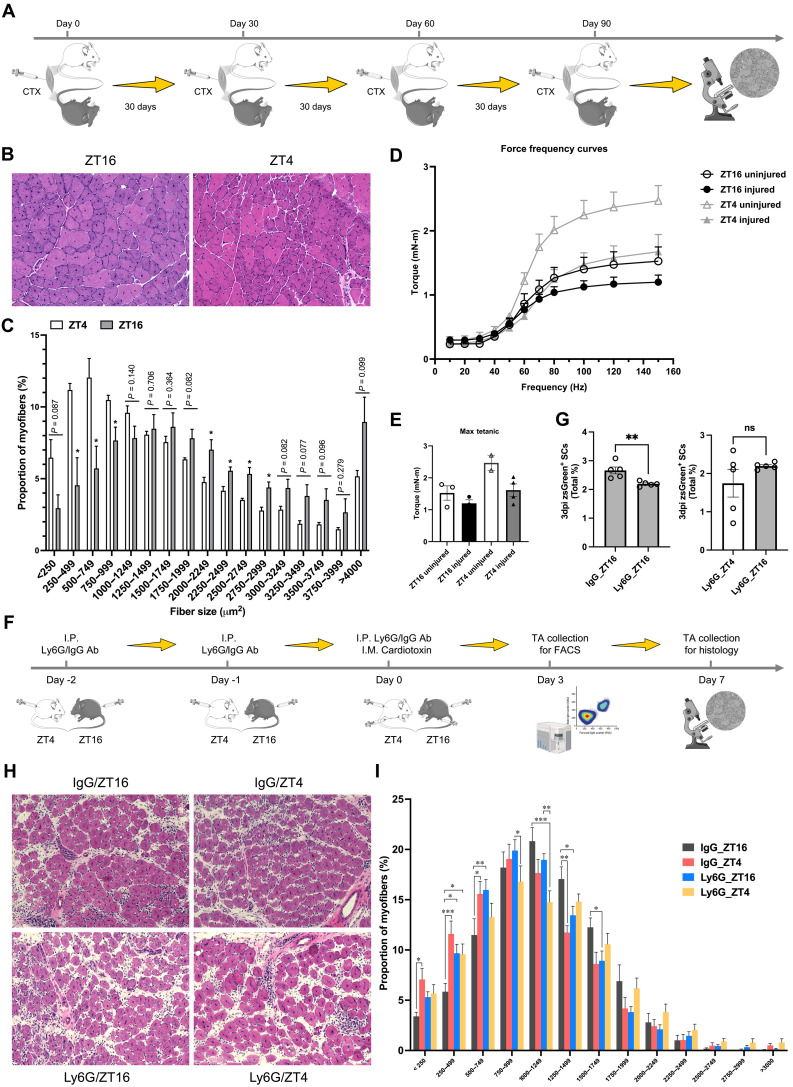
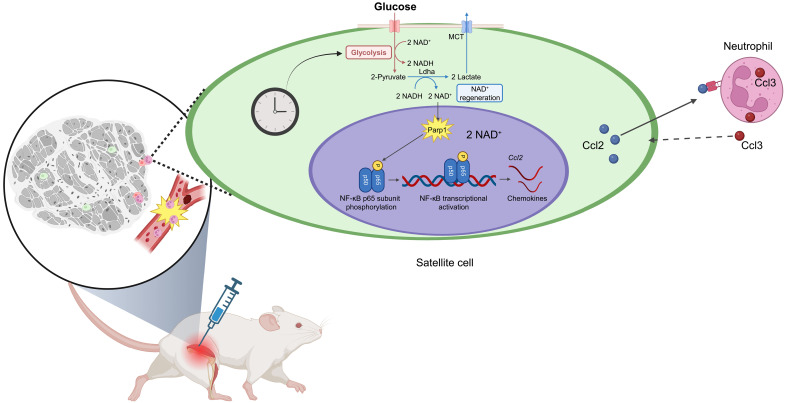
Circadian rhythms orchestrate physiological processes such as metabolism, immune function, and tissue regeneration, aligning them with the optimal time of day (TOD). This study identifies an interplay between the circadian clock within muscle stem cells (SCs) and their capacity to modulate the immune microenvironment during muscle regeneration. We reveal that the SC clock triggers TOD-dependent inflammatory gene transcription after injury, particularly genes related to neutrophil activity and chemotaxis. These responses are driven by cytosolic regeneration of the signaling metabolite nicotinamide adenine dinucleotide (oxidized form) (NAD+), as enhancing cytosolic NAD+ regeneration in SCs is sufficient to induce inflammatory responses that influence muscle regeneration. Mononuclear single-cell sequencing of the regenerating muscle niche further implicates the cytokine CCL2 in mediating SC-neutrophil cross-talk in a TOD-dependent manner. Our findings highlight the intersection between SC metabolic shifts and immune responses within the muscle microenvironment, dictated by circadian rhythms, and underscore the potential for targeting circadian and metabolic pathways to enhance tissue regeneration.


Figures

Fig. 1.
Fig. 1.. Elevated expression of glycolysis and inflammation-related genes in SCs following CTX injury.
(A) Schematic representation of the anaerobic glycolysis pathway. (B) Schematic diagram of experiment using SCs extracted from the hindlimb muscles of Pax7-zsgreen mice, both uninjured and following cardiotoxin-induced injury at ZT16, on day 1 post-injury, and subjected to RNA sequencing for transcriptome analysis. (C) Principal components analysis depicting the transcriptional disparities between ASCs at 1 dpi and QSCs. (D) Heatmap showing genes significantly up-regulated (adjusted P value <0.05) in ASCs at 1 dpi, highlighting associations with hypoxia and glycolysis, in comparison to QSCs. The color scale represents the log2 fold change, indicating the magnitude of gene expression changes. (E) Pathway enrichment analysis, using MSigDB hallmarks and gene ontology biological processes, for genes significantly up-regulated (adjusted P value <0.05) in ASCs at 1 dpi relative to QSCs.
Fig. 2.
Fig. 2.. Interactions between SCs and neutrophils during early muscle regeneration.
(A) Schematic diagram of single-cell sequencing experiment using mononucleated cells from the TA muscles of both hindlimbs were collected at ZT4 and ZT16 on day 0, 1, and 3 after injury. Single cells were collected through fluorescence-activated cell sorting (FACS), excluding dead cells identified by propidium iodide (PI) staining. Samples from each time point and day were captured in droplet emulsions using a 10x Chromium Controller (10x Genomics), aiming for 10,000 cells per sample, and then sequenced. (B) UMAP visualization of 21 annotated cell types within pooled TA muscle cells from all six samples. EC, endothelial cells; FAPs, fibro-adipogenic progenitors. (C) UMAP of neutrophil and MuSC single-cell transcriptomes split by days post-injury. (D) Chord diagram showing the specific ligand-receptor or signaling pathway–mediated interactions among the three cell clusters. The edge colors correspond to the source (sender) of the signal, and edge weights are proportional to the interaction strength, with thicker lines indicating stronger signals. Circle sizes reflect the number of cells in each cell group. (E) Circle plot showing the aggregated cell-cell communication network sent from MuSCs and received by individual clusters of neutrophils at various days post-injury. The inner, thinner bar colors represent the targets receiving signals from the corresponding outer bars. The size of the inner bar is proportional to the signal strength received by the targets.
Fig. 3.
Fig. 3.. NAD+ regeneration-induced immunomodulatory gene expression via PARP-mediated PARylation and NF-κB activation.
(A) NAD+ contents in wild-type myoblasts cultured in normoxia and hypoxia up to for 6 hours. n = 3 wells per condition. *P < 0.05 by one-way analysis of variance (ANOVA) test. (B) Schematic diagram of viral induction of LbNOX expression in primary myoblasts. (C) Ccl2 expression in myoblasts under conditions described in (B). *P < 0.05, **P < 0.01 by two-Way ANOVA. ns, nonsignificant. (D) Ccl2 expression in myoblasts subjected to hypoxia (1% O2) for 24 hours, both in the absence and presence of galloflavin. Normoxic myoblasts (21% O2) served as controls. ***P < 0.001 by one-way ANOVA, comparing each group to normoxic myoblasts. (E) Ccl2 expression in myoblasts treated for 24 hours with or without galloflavin. *P < 0.05, ***P < 0.001 by two-way ANOVA analysis. (F) Schematic diagram of MuSC conditional LbNOX (LbNOXmusc) mouse experiment (n = 3 per group). (G) Immunohistochemistry and quantification of mouse TA muscle for Ly6G+ neutrophils and laminin. Scale bar, 100 μm. (H) Representative immunofluorescence image and quantification of neutrophils in mouse TA muscle under conditions described in (F). *P < 0.05 by unpaired Student’s t test. (I) Immunofluorescence of global PARylation in myoblasts. LbNOX expression is marked by GFP coexpression. Scale bar, 200 μm. *P < 0.001 by unpaired Student’s t test. (J) Immunoblot analysis and quantification of global PARylation, serine-536–phosphorylated and total NF-κB p65 subunit, and β-actin in the absence (I) or presence (J) of BGP15. *P < 0.05 by unpaired Student’s t test. DMSO, dimethyl sulfoxide. (K) Immunomodulatory gene expression following a 6-hour treatment with or without BGP15. ***P < 0.001 by two-way ANOVA. (L) Ccl2 expression following a 6-hour treatment with or without EB47. *P < 0.05, ***P < 0.001 by one-way ANOVA.
Fig. 4.
Fig. 4.. TOD-dependent immunomodulatory expression in ASCs at day 1 post-injury.
(A) Schematic diagram of cardiotoxin-induced injury and SC isolation experiments in Pax7-zsgreen mice. (B) Volcano plot showing differentially expressed genes (DEGs, adjusted P < 0.05) in ASCs harvested from injured TA muscles at ZT4 compared to ZT16 at day 1 post-injury. (C) Signaling pathway enrichment analysis for genes more highly expressed in ASCs at ZT16 compared to ZT4 at 1 dpi. (D) UMAP of neutrophil and MuSC single-cell transcriptomes split by the TOD on day 1 post-injury. (E) Heatmap of ligand activities by NicheNet analysis showing ranked potential ligands expressed in the signal sender (MuSCs) that could predict the observed DEGs in neutrophil populations between ZT4 and ZT16 on day 1 post-injury. (F) Violin plot comparing expression of Ccl2 in ASCs at ZT4 and ZT16 on day 1 post-injury. (G) Schematic diagram of myoblast synchronization experiment. (H) Expression of Ccl2, Bmal1, and Per2 over the 24-hour cycle in dexamethasone-synchronized myoblasts under hypoxia. (I) Immunoblot analysis and relative quantification of total and serine-536–phosphorylated NF-κB p65 subunit and β-actin in synchronized myoblasts under hypoxia at CT4 and CT16, following a 6-hour treatment with or without EB47. (J) Ccl2 expression in synchronized myoblasts under hypoxia at CT4 and CT16, following a 6-hour treatment with or without EB47. *P < 0.05 by two-way ANOVA analysis. ns, nonsignificant.
Fig. 5.
Fig. 5.. Ccl2 secretion by SCs promotes TOD-dependent proliferative differences.
(A) UMAP visualization of the subclustered MuSC populations, with subclusters defined as dQSC, primed quiescent SCs (pQSC). committed SCs (Com_SC), dividing SCs (Div_SC), differentiating SCs (Diff_SC), and renewing SCs (Ren_SC). (B) Pseudotime trajectory inference analysis of MuSC subclusters by Slingshot, with deep QSCs serving as the starting point of pseudotime. (C) Pseudotime ordered single-cell expression trajectories for the genes that were most differentially expressed between the time points of ZT4 and ZT16 in lineage 1 and 2. (D) Signaling pathway enrichment analyses on the DEGs from (C). (E) Pseudotime ordered single-cell expression trajectories for the cell cycle regulators Cdk1 and Mki67 at ZT4 and ZT16 within lineage 2. (F) Representative FACS plot for MuSC gating (zsGreen+) at 3 dpi (top) and quantification of MuSC frequency within total mononucleated muscle cells (bottom). *P < 0.05 by unpaired Student’s t test (n = 5 mice per time point). (G) Schematic diagram of experiment using wild-type mice transplanted with myoblasts expressing GFP+ retrovirus and either Ccl2 (Ccl2-virus) or a control (R1) retroviruses (n = 4). Cardiotoxin-induced TA muscle injuries were performed at ZT16. Transplantation of 105 SCs occurred at 6 hours post-injury. At day 3 post-transplantation, total MuSC frequency and the percentage of GFP+ SCs within the total MuSC population were assessed by flow cytometry. (H) Quantification of CCL2 by ELISA in the media after 24 hours of culture from equal number of myoblasts infected with either Ccl2-expressing or control retrovirus. (I) Quantification of total MuSCs and GFP+ MuSCs in recipient TA muscles as described in (G). *P < 0.05 by unpaired Student’s t test.
Fig. 6.
Fig. 6.. Reduction of TOD-dependent variations in SC proliferation and muscle regeneration through neutrophil depletion.
(A) Schematic diagram of repeated cardiotoxin-induced injury at different times of day in wild-type mice (n = 3 per time point). Mice were euthanized at 30 days post-final injury, and TA muscles were assessed for muscle remodeling and function. (B) Representative hematoxylin and eosin (H&E) staining and (C) quantification of myofiber size distribution of the repeatedly injured TA muscles at ZT16 and ZT4 described in (A). (D) Measurement of torque variations in response to different stimulation frequencies in the TA muscles that were repeatedly injured at ZT4 and ZT16. Torque at each frequency along the force frequency curve plotted as mean ± SEM. (E) Peak torque generated in the force frequency curve (mean; SEM) for each group: ZT16u (1.526; 0.2237), ZT16i (1.200; 0.1101), ZT4u (2.470; 0.2365), ZT4i (1.614; 0.1968). (F) Schematic diagram of Pax7-zsGreen mice following transient neutrophil depletion through three consecutive intraperitoneal injections of Ly6G antibody (n = 5 per group). Control mice received IgG antibody injections from the same host species as the Ly6G antibody. (G) Quantification of zsGreen+ SCs on 3 dpi in the injured TA muscles from both IgG and Ly6G-treated mice (top), and in TA muscles from neutrophil-depleted mice injured at ZT4 and ZT16 (bottom). **P < 0.01 by unpaired Student’s t test. ns, nonsignificant. (H) Representative H&E staining of TA muscles from IgG and Ly6G treated mice that were injured at ZT4 and ZT16. (I) Quantification of myofiber size distribution in the injured TA muscles shown in (H). *P < 0.05, **P < 0.01, ***P < 0.001 by two-way ANOVA test.
Fig. 7.
Fig. 7.. Proposed model depicting the process underlying TOD-dependent muscle regeneration.
Schematic depicting the process underlying TOD-dependent muscle regeneration. Following injury, skeletal muscle experiences passive hypoxia, triggering enhanced anaerobic glycolysis in SCs. The regeneration of cytoplasmic NAD+ during this process acts as a substrate as activated PARP1, which then activates NF-κB through the phosphorylation of the p65 subunit at serine-536. This activation further promotes the expression of immunomodulator genes (e.g., Ccl2), aligning with a peak in neutrophil infiltration into the wounded site. This synchronization facilitates interactions between SCs and neutrophils, reciprocally enhancing SC proliferation and muscle repair efficiency. Given that the glycolysis pathway is regulated by the circadian clock, this signaling cascade contributes to variations in muscle repair efficacy depending on the TOD.

Update of

References

    1. Takahashi J. S., Transcriptional architecture of the mammalian circadian clock. Nat. Rev. Genet. 18, 164–179 (2017). - PMC - PubMed
    1. Bass J., Lazar M. A., Circadian time signatures of fitness and disease. Science 354, 994–999 (2016). - PubMed
    1. Bass J., Takahashi J. S., Circadian integration of metabolism and energetics. Science 330, 1349–1354 (2010). - PMC - PubMed
    1. Zhu P., Hamlish N. X., Thakkar A. V., Steffeck A. W. T., Rendleman E. J., Khan N. H., Waldeck N. J., DeVilbiss A. W., Martin-Sandoval M. S., Mathews T. P., Chandel N. S., Peek C. B., BMAL1 drives muscle repair through control of hypoxic NAD+ regeneration in satellite cells. Genes Dev. 36, 149–166 (2022). - PMC - PubMed
    1. Katoku-Kikyo N., Paatela E., Houtz D. L., Lee B., Munson D., Wang X., Hussein M., Bhatia J., Lim S., Yuan C., Asakura Y., Asakura A., Kikyo N., Per1/Per2–Igf2 axis–mediated circadian regulation of myogenic differentiation. J. Cell Biol. 220, e202101057 (2021). - PMC - PubMed