. 2025 Mar 7;11(10):eadq0444.
doi: 10.1126/sciadv.adq0444. Epub 2025 Mar 5.

An antidepressant mechanism underlying the allosteric inhibition of GluN2D-incorporated NMDA receptors at GABAergic interneurons

Affiliations

An antidepressant mechanism underlying the allosteric inhibition of GluN2D-incorporated NMDA receptors at GABAergic interneurons

Jilin Zhang et al. Sci Adv. .

Abstract

N-methyl-d-aspartate receptors (NMDARs), key excitatory ion channels, have gained attention as anti-depression targets. NMDARs consist of two GluN1 and two GluN2 subunits (2A-2D), which determine their pharmacological properties. Few compounds selectively targeting GluN2 subunits with antidepressant effects have been identified. Here, we present YY-23, a compound that selectively inhibits GluN2C- or GluN2D-containing NMDARs. Cryo-EM analysis revealed that YY-23 binds to the transmembrane domain of the GluN2D subunit. YY-23 primarily affects GluN2D-containing NMDARs on GABAergic interneurons in the prefrontal cortex, suppressing GABAergic neurotransmission and enhancing excitatory transmission. Behavioral assays demonstrate YY-23's rapid antidepressant effects in both stress-naïve and stress-exposed models, which are lost in mice with global or selective knockout of the grin2d gene in parvalbumin-positive interneurons. These findings highlight GluN2D-containing NMDARs on GABAergic interneurons as potential depression treatment targets.


Figures
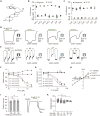
Fig. 1.
Fig. 1.. Specificity of YY-23 action on NMDAR subtypes.
(A) Chemical structure of YY-23. (B and C) Effects of YY-23 on 5HT1A, 5HT2B, and 5HT2C receptors (FLIPR Calcium 4 Assay) and 5HT2A, D1R, D2R, and D4R in both agonist and antagonist modes. Data were processed using an unpaired t test for normally distributed data and the Mann-Whitney test for nonnormally distributed data. (D and E) Representative current traces from recombinant NMDARs in Xenopus oocytes [(D), TEVC] with 100 μM glutamate, 100 μM glycine, and 10 μM YY-23 and from HEK293T cells [(E), whole-cell voltage-clamp] with 500 μM NMDA, 20 μM glycine, and 10 μM YY-23. (F and G) Concentration-response curves showing the effect of YY-23 on NMDARs in Xenopus oocytes (mean ± SD) and HEK293T cells (mean ± SEM). (H) Current-voltage (I-V) relationships for GluN1-GluN2D receptors with control (squares), 10 μM YY-23 (triangles), or 1 mM Mg2+ (circles) in the presence of saturating glycine and glutamate (100 μM each). (I) Statistical analysis of YY-23–mediated inhibition at holding potentials of −60, −40, and +40 mV. (J) Representative trace depicting the GluN1-GluN2D receptor response to a 1-min exposure to 10 μM YY-23 without agonists. (K) Inhibition efficacy of YY-23 on GluN1-GluN2D receptors at varying concentrations of glycine and glutamate, normalized to currents induced by 100 μM glycine and glutamate. (I) and (K) were analyzed by one-way analysis of variance (ANOVA). ns, not significant.
Fig. 2.
Fig. 2.. Structural determinants of YY-23 inhibition.
(A) Topological structure of GluN subunits showing NTD, LBD with S1 and S2 portions, TMD, and intracellular CTD. L1 and L2 are linkers connecting NTD-LBD and S2-M4, respectively. (B) Effects of 10 μM YY-23 on WT, chimeric, and truncated receptors in Xenopus oocytes. Top shows a linear representation for a GluN2 subunit corresponding to the topological structure in (A). Dashed line aligned with the media response of the GluN1-GluN2D WT receptor provides a benchmark for the YY-23–mediated inhibitory effect. Data were analyzed by Brown-Forsythe ANOVA with Dunnett’s T3 post hoc. Individual cells are represented by data points. Mean ± SEM are shown in bar graphs; box plots display minimum/maximum values, quartiles, and medians. Significance: “ns” (P > 0.05), **P < 0.01, ***P < 0.001, and ****P < 0.0001. (C) Current traces of chimeric receptors responding to 10 μM YY-23 with saturating concentrations (100 μM) of glycine and glutamate (“Gly/Glu”). (D) Electron density map of GluN1b-GluN2D receptor bound with YY-23 (yellow). (E) Structure of YY-23 bound to GluN1-GluN2D receptor. (F) Detailed view of YY-23 density (mesh) within the binding site constituted by the M1, M2, and M4 helices of GluN2D subunit. (G) Top-down view of the TMD of GluN1b-GluN2D receptor with YY-23 bound.
Fig. 3.
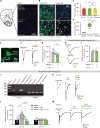
Fig. 3.. YY-23 inhibits activity of interneurons via GluN2D subunit.
(A) Coronal mouse brain section showing mPFC (dashed box), with confocal imaging of DNA (4′,6-diamidino-2-phenylindole, blue), grin2d mRNA (red), and Slc32a1 mRNA (green) using multiplex FISH. Dashed lines indicate mPFC layers. PrL; prelimbic cortex; IL, infralimbic cortex; Cg1, cerebral cortex, area 1. (B) Localization of Sic17a7 (pyramidal neurons, green), Slc32a1 (interneurons, green), and grin2d (red), with magnified views. Arrows highlight grin2d-positive neurons. (C and D) Quantification of single or dual mRNA-positive cells. Data were analyzed using one-way ANOVA for normally distributed data (C) and Brown-Forsythe ANOVA with Dunnett’s T3 multiple comparisons for data with heterogeneous variance (D). (E) Patch-clamp setup from GAD67-GFP–positive mPFC slices. (F to I) NMDA-induced currents with/without 20 μM YY-23 in interneurons [(F) and (G)] and pyramidal neurons [(H) and (I)] from WT mice. Representative traces shown. Wilcoxon test for paired comparisons. (J) Quantitative PCR of mRNA in WT and grin2d knockout (KO) mice. (K and L) NMDA currents with 20 μM YY-23 and/or 3 μM CIQ in interneurons from WT and grin2d KO mice. Representative traces shown. [(K) and (L)] Representative recording traces. Data underwent one-way ANOVA and Tukey’s multiple comparisons for histograms (M). Each point denotes an individual cell. Bar graphs represent mean ± SEM. Box plots depict min/max values, quartiles, and median lines. Significance: ns (P > 0.05), **P < 0.01, and ***P < 0.001.
Fig. 4.
Fig. 4.. YY-23 up-regulated activity of pyramidal neuron by inhibiting interneuron.
(A) Coronal mouse brain section showing electrode placement in the prelimbic area (PrL). (B and C) Active potential recordings (B) from GAD67-EGFP–positive interneurons (C) in the mPFC. (D and E) Spike counts from graded current injections (0 to 350 pA in 50-pA steps) on interneurons with varying YY-23 concentrations (D). Data analyzed by Kruskal-Wallis ANOVA and Dunn’s post hoc test. Box plots show min/max values, quartiles, and medians (E). (F to K) sIPSC recordings in mPFC pyramidal neurons from WT and grin2d−/− mice, before and after 10 μM YY-23. Cumulative distributions of sIPSC intervals [(H) and (K)] and frequencies [(G) and (J)] analyzed by Kolmogorov-Smirnov test. (L and M) Bar graphs comparing sIPSC frequencies (L) and amplitudes (M) at baseline (gray) and post–YY-23 (green) in WT and grin2d−/− mice, analyzed by repeated measures (RM) two-way ANOVA with Bonferroni’s post hoc test. (N) AP recordings in pyramidal neurons with YY-23 in WT versus grin2d−/− mice. (O and P) Spike frequency response to current injections in pyramidal neurons with YY-23 in WT (O) and grin2d−/− mice (P). (Q) Average spike counts pre– and post–YY-23 in WT and grin2d−/− mice, analyzed by RM two-way ANOVA with Bonferroni’s test. Bar graphs show mean ± SEM. Significance: *P < 0.05, **P < 0.01, and ***P < 0.001.
Fig. 5.
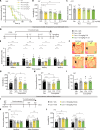
Fig. 5.. Rapid antidepressant effect of YY-23 on mice.
(A to C) YY-23 shows dose-dependent antidepressant-like effects in stress-naïve mice, as measured by the novelty-suppressed feeding test (A) and forced swimming test (B). No impact on locomotion was observed in the OFT (C). Data analyzed by Kaplan-Meier survival analysis with Mantel-Cox test (A) and one-way ANOVA with Dunn’s correction [(B) and (C)]. (D) Experimental timeline for behavioral tests, drug administration, and brain tissue collection in a CSDS model. Mice received treatments of vehicle, fluoxetine (FLX), or YY-23 after 10 days of social stress, with tissue collected 24 hours after the final dose. (E) Social interaction (SI) ratio for each group weekly, analyzed by repeated measures (RM) two-way ANOVA with Tukey’s test. (F) Exploratory trajectories of C57BL/6N mice with 21 days of drug administration. Yellow box shows the SI zone. “Sus” indicates susceptible mice. (G to I) TST (G), SPT (H), and OFT (I) were assessed, and data were analyzed by one-way ANOVA with Tukey’s test. (J to L) Overview and effects of YY-23 and (S)-ketamine in a corticosterone-induced depressive model. SPT (K) and FST (L) data analyzed by RM two-way ANOVA with Tukey’s test. Bar graphs represent mean ± SEM. Significance: *P < 0.05, **P < 0.01, and ***P < 0.001.
Fig. 6.
Fig. 6.. Genetic deletion of grin2d abolished the antidepressant-like effect of YY-23.
(A to C) YY-23 reduced immobility time in the FST (A) and TST (B) in WT (grin2d+/+) mice but not in grin2d KOs (grin2d+/− and grin2d−/−), indicating the need for the grin2d gene for YY-23’s effects. No changes in locomotion were observed in the OFT (C). (D to F) Behavioral effects of YY-23 on mice with (PV-Cre grin2df/− and PV-Cre grin2df/f) and without (grin2df/f) grin2d deletion in PV-positive interneurons. Data were analyzed by two-way ANOVA with Bonferroni correction. Bar graphs show means ± SEM. Significance: *P < 0.05 and **P < 0.01.
Fig. 7.
Fig. 7.. YY-23 enhanced synaptic transmission based on proteomic analysis.
(A) Clustering of differentially expressed proteins in the mPFC from control (Ctrl-Veh) and susceptible mice treated with vehicle, fluoxetine (10 mg/kg; Sus-FLX), or YY-23 (10 mg/kg; Sus-YY-23) (n = 3 per group). Sampling details are in Fig. 4D. (B) Venn diagram showing altered proteins in the stress group versus control and in the YY-23 group versus the stress group, with YY-23 rescuing 26 proteins. (C) Clustering of these 26 proteins indicating restoration by YY-23 in susceptible mice. (D) Gene Ontology (GO) enrichment analysis of the biological processes related to these proteins.
Fig. 8.
Fig. 8.. YY-23 enhances LTP in mPFC, contributing to its antidepressant effect.
(A) Schematic of fEPSP recording with stimulating electrode in layer VI and recording electrode in layer II/III; example traces are shown. (B and C) fEPSP slopes with (B) and without (C) rapamycin preperfusion. YY-23 and DMSO were administered at time zero (green line). CNQX was applied at 40 min to evaluate AMPAR involvement. Differences were analyzed using the Kolmogorov-Smirnov test. (D) YY-23 substantially increased fEPSP slope, an effect blocked by rapamycin preperfusion. (E and F) TST (E) and elevated plus maze (F) assessed the antidepressant-like effects of YY-23 in mice with 30-min preperfusion of DMSO or rapamycin in the PFC. Data [(D) to (F)] were analyzed by two-way ANOVA with Bonferroni post hoc test. Bar graphs show means ± SEM. Significance: *P < 0.05 and **P < 0.01.

References

    1. Malhi G. S., Mann J. J., Depression. Lancet 392, 2299–2312 (2018). - PubMed
    1. Gaynes B. N., Warden D., Trivedi M. H., Wisniewski S. R., Fava M., Rush A. J., What did STAR*D teach us? Results from a large-scale, practical, clinical trial for patients with depression. Psychiatr. Serv. 60, 1439–1445 (2009). - PubMed
    1. Kadriu B., Musazzi L., Henter I. D., Graves M., Popoli M., Zarate C. A. Jr., Glutamatergic neurotransmission: Pathway to developing novel rapid-acting antidepressant treatments. Int. J. Neuropsychopharmacol. 22, 119–135 (2019). - PMC - PubMed
    1. Tomasetti C., Montemitro C., Fiengo A. L. C., Santone C., Orsolini L., Valchera A., Carano A., Pompili M., Serafini G., Perna G., Vellante F., Martinotti G., Giannantonio M. D., Kim Y. K., Nicola M. D., Bellomo A., Ventriglio A., Fornaro M., Berardis D. D., Novel pathways in the treatment of major depression: Focus on the glutamatergic system. Curr. Pharm. Des. 25, 381–387 (2019). - PubMed
    1. Berman R. M., Cappiello A., Anand A., Oren D. A., Heninger G. R., Charney D. S., Krystal J. H., Antidepressant effects of ketamine in depressed patients. Biol. Psychiatry 47, 351–354 (2000). - PubMed

MeSH terms

Substances