. 2025 Mar 7;11(10):eadr5086.
doi: 10.1126/sciadv.adr5086. Epub 2025 Mar 5.

Kir7.1 is the physiological target for hormones and steroids that regulate uteroplacental function

Affiliations

Kir7.1 is the physiological target for hormones and steroids that regulate uteroplacental function

Monika Haoui et al. Sci Adv. .

Abstract

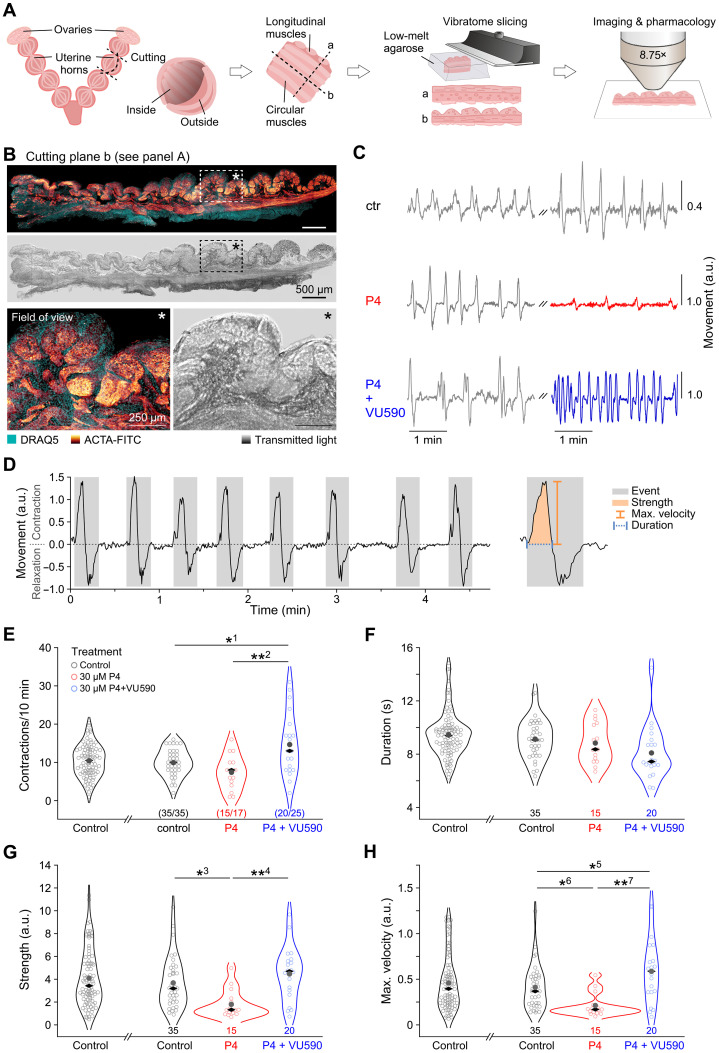
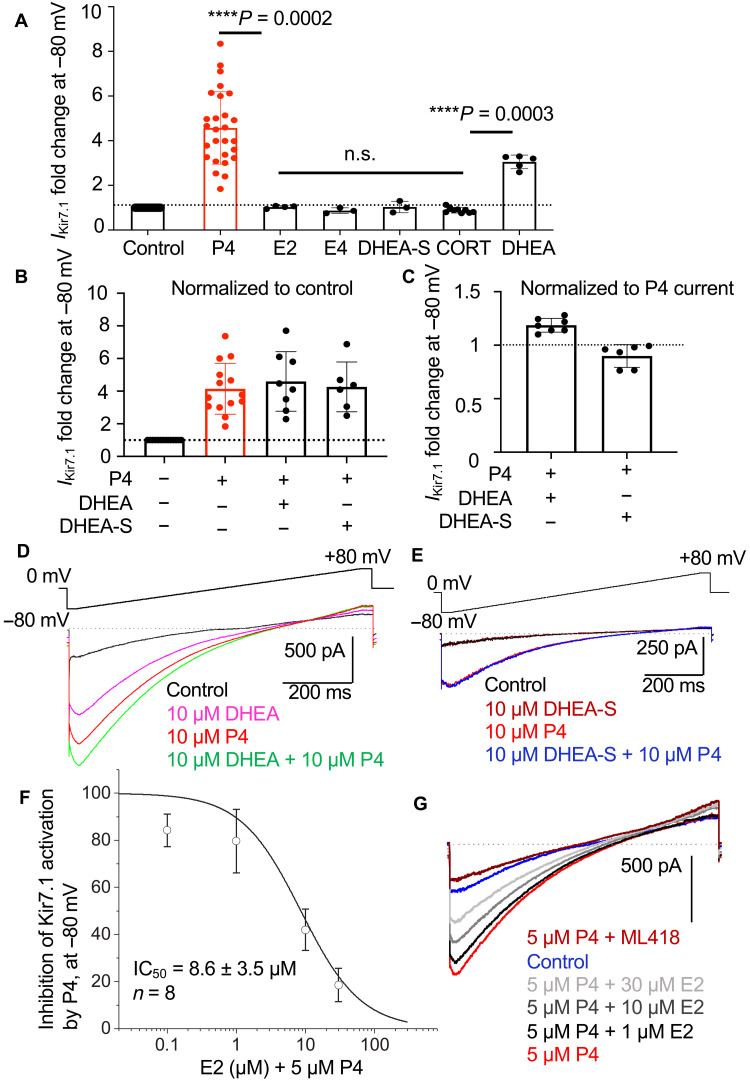
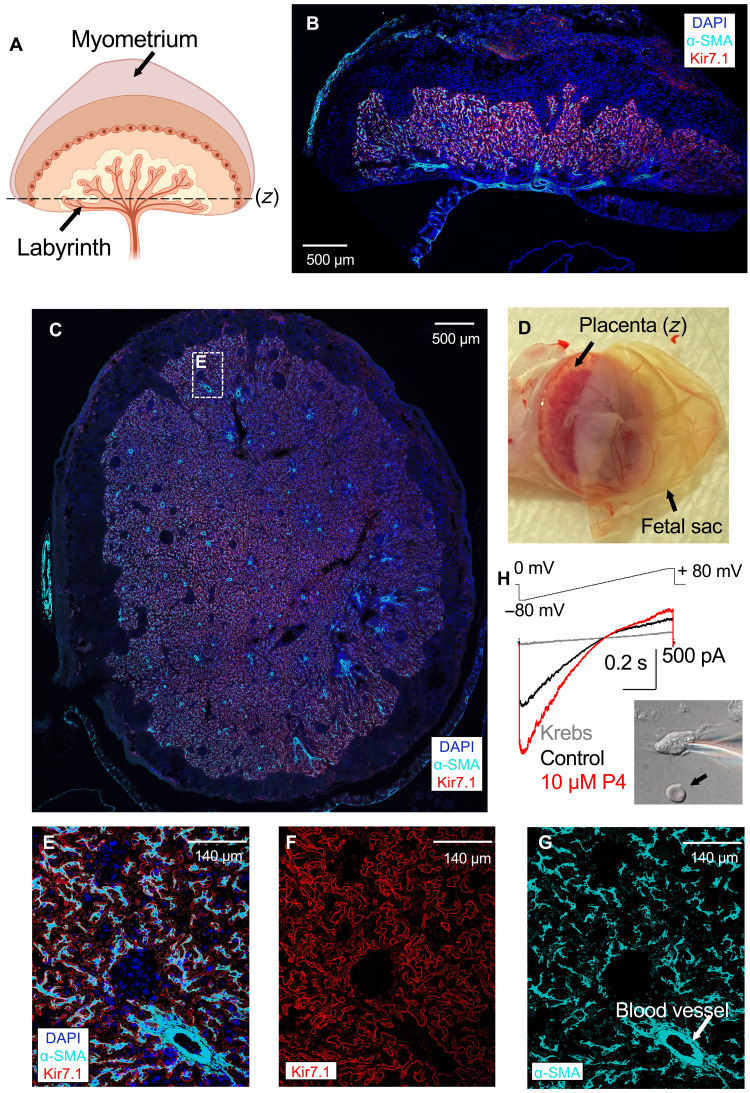
Preterm birth is detrimental to the well-being of both the mother and the newborn. During normal gestation, the myometrium is maintained in a quiescent state by progesterone. As a steroid hormone, progesterone is thought to modify uterine and placental morphology by altering gene expression, but another direct mode of action has long been suspected. Here, we reveal the nongenomic molecular mechanism of progesterone as the activation of human and murine inwardly rectifying potassium channel Kir7.1, which is expressed in myometrium and placental pericytes during late gestation. Kir7.1 is also activated by selective steroids, including those used to prevent premature labor, such as 17-α-hydroxyprogesterone caproate and dydrogesterone, revealing their unexpected mode of action. Our results reveal that Kir7.1 is the molecular target of both endogenous and synthetic steroids that control uterine excitability and placental function. Kir7.1, therefore, is a promising therapeutic target to support healthy pregnancy during mid and late gestation.


Figures

Fig. 1.
Fig. 1.. Kir7.1 expression and localization in the murine myometrium.
(A) Schematic representation of mouse uterine morphology during gestation. The insert shows different uterine layers, including the endometrium, circular myometrial inner layer, vascular and longitudinal myometrial layers. Created with BioRender.com. (B) Nonpregnant uterus co-stained with anti–smooth muscle α-actin antibody (α-SMA; cyan), anti-Kir7.1 antibody (red), and 4′,6-diamidino-2-phenylindole (DAPI; blue, indicating nuclei). Lack of red signal indicates absence of Kir7.1 expression. (C) Zoomed-in portion of myometrium corresponding to dotted frame in (B) with all three channels superimposed. (D) Portion of myometrium (same as in C) with only single channel (anti-Kir7.1 antibody; red) shown, indicating an absence of Kir7.1. (E) Isolated mouse uterus at 15.5 days post coitum (dpc) with placentae (red tissue) and myometrium (white tissue) shown. Two separate regions of myometrium: adjacent to placenta [(F); IS, implantation site] and between placentae [(H); IIS, inter-implantation site] are framed. (I) An insert shows the isolated portion of IIS myometrial section (as in H) between placentae, fixed, stained, and visualized as in (B), with all three channels superimposed. Myocytes from this section lack Kir7.1 expression. (G) The isolated portion of IS myometrial section (as in F) adjacent to placenta, fixed, stained, and visualized as in (B), with all three channels superimposed. Two regions are indicated: (J) that includes both circular and longitudinal myometrial tissue and shows Kir7.1 presence [(J) and (K), anti-Kir7.1, red], as well as apical endometrium/decidua surrounding the placenta (L) that also expresses Kir7.1 [(L) and (M), anti-Kir7.1, red].
Fig. 2.
Fig. 2.. Progesterone and VU590 antagonistically affect myometrial contractions.
(A) Schematic illustrating the experimental approach. Blocks of dissected murine myometrium (14.5 dpc) were embedded in agarose and slices were cut along the axes of either the longitudinal (a) or circular (b) muscles. (B) The latter were immunostained against α-SMA (ACTA-FITC). Top color micrograph: Confocal fluorescence indicating smooth muscle. Nuclei are stained with DRAQ5 (cyan). Longitudinal muscles are cut transversally. Bottom micrograph: Corresponding transmitted light image. Rectangles with asterisks mark the area of higher magnification below that represents field of view in time-lapse recordings. (C) Representative traces (pixel displacement versus time) depicting spontaneous myometrial contractions under control condition (left) and during a later period under three different conditions (right): (i) control (ctr; top; gray); (ii) 30 μM P4 incubation (middle; red); and (iii) simultaneous incubation with 30 μM P4 and 20 μM VU590 (bottom; blue). (D) Representative time-lapse recording of myometrial contractility [pixel displacement in arbitrary units (a.u.) versus time]. Dotted line indicates resting state. Individual contraction-relaxation events (gray boxes) are characterized by successive peaks in opposite direction. Right: A single event to illustrate analysis parameters, i.e., contraction strength (orange area), maximum velocity (orange line), and duration (blue dotted line) of contractions. (E to H) Quantification of myometrial contractions in the absence or presence of either 30 μM P4 or 30 μM P4 and 20 to 100 μM VU590. Violin plots display data from individual regions of interest (ROIs; circles; n denoted below violins) as well as means (gray filled circles) and medians (black diamonds). (E) Contraction count per 10-min recording. (F) Duration of myometrial contractions. (C to E) Each circle represents the mean of several events. (G) Contraction strength as calculated from the area under curve in a.u. (H) Maximal contraction velocity in a.u. Asterisks denote statistical significance (*1P = 0.008; **2P = 0.001; *3P = 0.015; **4P = 0.001; *5P = 0.05; *6P = 0.041; **7P = 0.0002).
Fig. 3.
Fig. 3.. Progesterone activates recombinant hKir7.1 expressed in myometrial cells as well as in HEK293 cells.
(A) Immunocytochemistry of recombinant hKir7.1 (red) in HEK293 cells visualized with anti-Kir7.1 antibody. (B) Individual HEK293 cell transfected as described in (A) shows typical membrane localization of hKir7.1 (red). (C) Western blot of the protein lysates isolated from HEK293 cells transfected with either: (i) empty vector [pIRES2-eGFP; (−); no Kir7.1 signal] or (ii) pIRES2-eGFP-hKir7.1 [+; glycosylated, and, likely, a shorter immature isoform of Kir7.1 is seen]. The blot was probed with anti-Kir7.1 antibody, and β-actin was used as loading control. (D) Immunocytochemistry of human uterine smooth muscle cells (HUtSMCs) transfected with pIRES2-eGFP-hKir7.1. (E) Representative traces of hKir7.1-derived potassium conductance recorded from HEK293 cells transfected with either empty vector (top) or hKir7.1 (bottom). (F) Representative traces of hKir7.1-derived potassium conductance recorded from HUtSMCs transfected with either empty vector (top) or hKir7.1 (bottom). (G and H) The average current fold increase (FI) recorded at −80 mV for recombinant hKir7.1 expressed either in HEK293 (G) or HUtSMCs (H). Transfection with a pIRES2-eGFP-hKir7.1 showed 5- to 10-fold potentiation of the currents after cells were stimulated with 10 μM P4. The cells transfected with the empty vector do not respond to P4 or display hKir7.1 current. (I and J) Dose-response relationships and corresponding EC50 values (I) for P4 activation recorded from two different cell lines, HEK293 or HUtSMCs, as well as representative recordings (J) transiently transfected with pIRES2-eGFP-hKir7.1. Potassium currents depicted on (E) to (J) were recorded in response to an indicated voltage ramp. Dose-response curves were calculated using the average current density at −80 mV for n = 14 and n = 10 cells for HEK293 and HUtSMCs, respectively. EC50 for P4 obtained from both conditions were similar. Data are means ± SEM.
Fig. 4.
Fig. 4.. Potentiation of hKir7.1 by endogenous steroids.
(A) The average current FI of hKir7.1 at −80 mV recorded from recombinant protein expressed in HEK293 cells that were exposed to 10 μM of the following compounds: P4, E2, estetrol (E4), DHEA-S, cortisol (CORT), and DHEA. Statistics are as follows: control: n = 29; P4: 4.57 ± 0.31, n = 27; E2: 1.03 ± 0.03, n = 4; E4: 0.87 ± 0.07, n = 3; DHEA-S: 1.03 ± 0.15, n = 3; cortisol: 0.89 ± 0.04, n = 9; and DHEA: 3.05 ± 0.14, n = 5. Amplitudes were normalized to control. Asterisks denote statistical significance and the corresponding P values calculated using nonparametric Kruskal-Wallis test; n.s. stands for nonsignificant. (B) The average current FI of recombinant hKir7.1 at −80 mV recorded from HEK293 cells that were exposed to the combination of steroids indicated. There were no differences regarding the order in which steroids were applied first. However, the combination of P4 with either DHEA or DHEA-S was always applied last. P4 and DHEA were able to activate hKir7.1, while DHEA-S did not change hKir7.1 response. Statistics are as follows: control: n = 14; P4: 4.14 ± 0.42, n = 14; P4 + DHEA: 4.60 ± 0.65, n = 8; and P4 + DHEA-S: 4.27 ± 0.62, n = 6. Amplitudes were normalized to control. (C) Current densities of combined P4/DHEA or P4/DHEA-S were normalized to P4-responses. Statistics are as follows: P4 + DHEA: 1.19 ± 0.02, n = 7; and P4 + DHEA-S: 0.86 ± 0.06, n = 4. (D and E) Representative traces of hKir7.1-derived currents for experiments depicted in (B) and (C). (F) The inhibition of P4-activation of hKir7.1 by E2. Median inhibitory concentration (IC50) of E2 inhibition was calculated using the average current density obtained at −80 mV for eight cells recorded from hKir7.1-expressing HEK293. (G) Representative traces for (F). To confirm that P4 and steroids activate hKir7.1-derived potassium conductance, a specific inhibitor for hKir7.1, ML418 was used. Data are means ± SEM.
Fig. 5.
Fig. 5.. Regulation of hKir7.1 by synthetic steroids.
(A) The average current FI of recombinant hKir7.1 at −80 mV recorded from HEK293 cells exposed to either 10 μM P4 or 10 μM and 50 μM 17-OHPC. Control: n = 8; P4: 4.61 ± 0.51, n = 8; 10 μM 17-OHPC: 5.52 ± 0.78, n = 7; and 50 μM 17-OHPC: 6.47 ± 1.06, n = 5. (B) Time course of steroid activation and washout. Averaged Kir7.1 current amplitudes from HEK293 cells as described in (A) obtained at −80 mV were plotted against time to show a fast response to P4 (red) and its fast washout. The responses to 10 μM 17-OHPC were slower and required a much longer washout. The time of compound’s application to the bath solution is indicated by the bars above. (C) The average current FI of hKir7.1 at −80 mV after exposure to 10 μM dydrogesterone (DYG). Control: n = 5; and DYG: 3.40 ± 1.01, n = 5. Amplitudes were normalized to control. (D) Current densities as described in (C); control: −20.05 ± 9.07, n = 5; and DYG: −42.89 ± 12.25, n = 5. (E) Representative hKir7.1 traces recorded as mentioned in (C). (F) The average current FI of hKir7.1 obtained at −80 mV from transfected HEK293 after exposure to 10 μM P4 alone, in the presence of 50 μM RU486, or the combination of both. Control: n = 8; P4: 3.73 ± 0.45, n = 8; P4 + RU486: 2.46 ± 0.23, n = 8; and RU486: 0.91 ± 0.04, n = 6. Amplitudes are normalized to control. (G) The averaged amplitude of cellular response to P4 and RU486 combination from (F) was normalized to the amplitude of P4 response. Control: n = 8; and P4 + RU486: 0.68 ± 0.03, n = 8. (H) The representative recombinant hKir7.1 responses from HEK293 cells after exposure to 50 μM RU486 with or without P4. **P ≤ 0.01 calculated with paired t test. Data are means ± SEM.
Fig. 6.
Fig. 6.. Kir7.1 expression and localization in the murine placental labyrinth.
(A) Schematic of the uteroplacental unit. The labyrinth and the horizontal section plane (z) are shown. Created with BioRender.com. (B) Immunostaining of the coronal section of murine uteroplacental unit isolated from 15.5 dpc. The coronal section was co-stained with anti–α-SMA antibody (cyan), anti-Kir7.1 antibody (red), and DAPI (blue, indicating nuclei). An intense Kir.7.1 signal (red) was detected in the placental labyrinth. (C) Immunostaining of the horizontal cross section through labyrinth through the plane (z) as shown in (A) collected at 15.5 dpc. The section was co-stained as described in (B). Kir7.1 (red) signal was co-localized with intense signal from non-vascular α-SMA containing cells (cyan). (D) Isolated murine uteroplacental unit with placenta and fetal sac indicated. Plane (z) is indicated as in (A). (E) Zoomed-in portion placental labyrinth as indicated in dotted frame in (C). Placental labyrinth co-stained as in (B) with all three channels superimposed. Red and cyan signals confirm that Kir7.1 is expressed in pericytes but absent from vascular smooth muscles. Cell nuclei are stained by DAPI (blue). (F) Inset E from (C) shows strong Kir7.1 staining (red) with typical membrane localization of the ion channel. (G) Same section as in (E) visualized with anti–α-SMA (cyan) antibodies reveals a number of cells with pleomorphic morphology typical for placental pericytes. Additionally, vascular smooth muscles surrounding blood vessels (cyan, indicated by arrow) are also shown. (H) Representative Kir7.1 current recorded from isolated placental pericytes (differential interference contrast image of the cell is shown in the insert, and arrow indicates red blood cell). This recording shows characteristic inward rectification typical for Kir7.1 that is further stimulated by exposure to 10 μM P4.

References

    1. What is the strongest muscle in the human body (2019/updated 2024); www.loc.gov/everyday-mysteries/biology-and-human-anatomy/item/what-is-th....
    1. Wray S., Arrowsmith S., Uterine excitability and ion channels and their changes with gestation and hormonal environment. Annu. Rev. Physiol. 83, 331–357 (2021). - PubMed
    1. Wray S., Noble K., Sex hormones and excitation-contraction coupling in the uterus: The effects of oestrous and hormones. J. Neuroendocrinol. 20, 451–461 (2008). - PubMed
    1. Khan-Dawood F. S., Dawood M. Y., Estrogen and progesterone receptor and hormone levels in human myometrium and placenta in term pregnancy. Am. J. Obstet. Gynecol. 150, 501–505 (1984). - PubMed
    1. Astle S., Slater D. M., Thornton S., The involvement of progesterone in the onset of human labour. Eur. J. Obstet. Gynecol. Reprod. Biol. 108, 177–181 (2003). - PubMed