. 2025 Mar 7;11(10):eadu5110.
doi: 10.1126/sciadv.adu5110. Epub 2025 Mar 5.

Epstein-Barr virus infection promotes T cell dysregulation in a humanized mouse model of multiple sclerosis

Affiliations

Epstein-Barr virus infection promotes T cell dysregulation in a humanized mouse model of multiple sclerosis

Jessica R Allanach et al. Sci Adv. .

Abstract

Latent infection with Epstein-Barr virus (EBV) is a strong risk factor for the development of multiple sclerosis (MS), although the underlying mechanisms remain unclear. To investigate this association, we induced experimental autoimmune encephalomyelitis (EAE) in immunodeficient mice reconstituted with peripheral blood mononuclear cells (PBMCs) from individuals with or without a history of EBV infection and/or relapsing MS (RRMS). HuPBMC EAE mice generated from EBV-seronegative healthy donors were less susceptible to developing severe neurological symptoms than healthy EBV-seropositive and RRMS donor groups. Donor EBV seropositivity and RRMS diagnosis were associated with a significant increase in the number of central nervous system (CNS) infiltrating effector T cells due to enhanced proliferation of proinflammatory T cells and limited expansion of regulatory T cells. The data indicate that a history of EBV infection, further compounded by a diagnosis of RRMS, promotes T cell-mediated xenogeneic CNS disease in a humanized mouse model of MS.


Figures

Fig. 1.
Fig. 1.. Donor EBV infection and RRMS diagnosis worsen clinical outcomes in HuPBMC EAE mice.
(A) Experimental design: Donor PBMCs isolated from women with or without a history of EBV infection or an RRMS diagnosis were used to engraft immunocompromised NSG mice. Following a 3-week reconstitution period and confirmation of circulating human CD45+ cell repopulation, humanized NSG mice (HuPBMC) were immunized with recombinant human myelin oligodendrocyte glycoprotein (rhMOG) antigens to induce EAE. (B) Donor serum IgG specific to acute EBV antigen viral capsid antigen (VCA). (C) Donor serum immunoglobulin G (IgG) specific to latent EBV antigen Epstein-Barr nuclear antigen 1 (EBNA-1). In (B) and (C), group data are shown as means with SEM and were curve fit with a one-site total binding equation. Statistical differences in titer curves were assessed by ordinary two-way analysis of variance (ANOVA). (D) Cell-associated EBV viral loads in donor PBMCs measured by BALF5 quantitative polymerase chain reaction (qPCR) assay. Data are shown as means with SEM and were analyzed by ordinary one-way ANOVA with Tukey’s multiple comparisons test. In (B) to (D), n = 3 to 4 donors per group and the lower limit of detection (LOD) for each assay is represented by a dotted line. (E) Clinical disease scores post-induction for symptomatic HuPBMC EAE mice. Data are shown as means with SEM, and curves were analyzed by ordinary two-way ANOVA (n = 17 to 25 mice per group derived from three to four donors per group). (F) Incidence of clinical EAE symptoms post-induction. Data are shown as percentage of the group, and curves were analyzed by log-rank (Mantel-Cox) test (n = 54 to 62 mice per group derived from three to four donors per group). (G) Day of EAE symptom onset post-induction (DPI). Distribution of individual data is shown with median and quartiles (dashed lines) and was analyzed by Brown-Forsythe and Welch ANOVA with Dunnett’s T3 multiple comparisons test (n = 17 to 25 mice per group derived from three to four donors per group).
Fig. 2.
Fig. 2.. EAE induction in HuPBMC mice causes human T cell infiltration and inflammatory demyelination of the CNS.
(A) Demyelination of the spinal cord in the HuPBMC EAE model. Perfused spinal cords were obtained days 19 to 25 post-induction (5 to 8 days post–symptom onset) from HuPBMC EAE mice and days 15 to 25 post-induction from NOD EAE mice (5 to 15 days post–symptom onset). Eriochrome cyanine–stained sections (top) obtained from the lower thoracic region of the spinal cord show representative myelination indices (MI) for each of the respective group means. Individual data points represent averages of serial sections sampled from four to six equidistant regions along the entire length of the spinal cord (n = 18 regional points from three unengrafted NSG control mice; n = 22 to 36 regional points from five to six mice per group for EAE-induced NOD and HuPBMC groups). Distribution of individual data is shown with median and quartiles (dashed lines) and was analyzed by Kruskal-Wallis with Dunn’s multiple comparisons test. (B to D) Human CD8+ cells infiltrate the CNS of HuPBMC EAE mice engrafted with RRMS donor PBMCs. Representative images of lumbar spinal cord (B) and cerebellar (C and D) sections from an unengrafted control NSG mouse (left) and a symptomatic HuPBMC EAE mouse (right) derived from a donor with RRMS. Perfused tissues were collected day 15 post–EAE induction (day 4 post–symptom onset). Sections were labeled with FluoroMyelin (green), NeuroTrace 530/615 (red), 4′,6-diamidino-2-phenylindole (DAPI; blue), anti-hCD8 (yellow), and anti–Iba-1 (light blue). Example hCD8+ cells are indicated by white arrowheads (B and C), and hCD8+ cells in proximity to Iba-1+ cells by red arrowheads (D). Scale bars indicate size as specified per panel, showing (A) 200 μm; (B) 200 μm and (insets) 50 μm; (C) 500 μm and (insets) 50 μm; and (D) 100 μm and (inset) 50 μm.
Fig. 3.
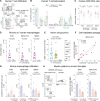
Fig. 3.. EAE in HuPBMC mice is mediated by infiltrating human TH1 and cytotoxic T cells and by murine myeloid cells.
(A) Spinal cord–infiltrating inflammatory T cell subsets. (B) Human T cell subsets quantified in whole tissues. In (A) and (B), perfused tissues were collected day 22 post-induction, and cells were stimulated with phorbol 12-myristate 13-acetate (PMA) and ionomycin (n = 18 mice from one EBV+ HD). (C) Human CD8+:CD4+ T cell ratios in symptomatic or subclinical HuPBMC EAE tissues (n = 10 to 21 mice per group). (D) Numbers of murine (mCD45hiCD11bhiF4/80+) and human (hCD45+CD14+CD68+) macrophages in HuPBMC EAE tissues (n = 16 mice per group). (E) Frequency of murine macrophages containing intracellular myelin basic protein (MBP) in HuPBMC EAE tissues (n = 16 mice per group). (F) Correlation between numbers of spinal cord–infiltrating hCD3+CD8+ T cells and murine macrophages containing intracellular MBP (n = 16 mice). (G) Numbers of infiltrating murine macrophages in the tissues of symptomatic and subclinical HuPBMC EAE mice or uninduced HuPBMC control mice (n = 6 to 10 mice per group). (H) Numbers of murine microglia containing intracellular MBP in the CNS of symptomatic and subclinical HuPBMC EAE mice or uninduced HuPBMC control mice (n = 6 to 10 mice per group). In (C) to (H), perfused tissues were collected days 14 to 24 post-induction of cohorts derived from two to three unrelated EBV+ HDs, and data were combined for analysis. In [(B) to (D)], [(E), (G), and (H)], data are shown as means with SEM. In [(C) and (D)], data were analyzed by Mann-Whitney test. In [(E), (G), and (H)], data were analyzed by Kruskal-Wallis with Dunn’s multiple comparisons test or by Brown-Forsythe and Welch ANOVA with Dunnett’s T3 multiple comparisons test. In (F), data were analyzed by simple linear regression (dashed lines show 95% confidence interval). Concatenated flow plots show mean frequency of parent population ± SD.
Fig. 4.
Fig. 4.. Donor EBV and RRMS status promote human immune cell infiltration of the HuPBMC EAE CNS without viral reactivation.
(A) Total human CD45+ immune cell counts, (B) hCD19+ B cell counts, (C) hCD3+ T cell counts, (D) EBV genome copies in splenic DNA, (E) hCD3+CD4+ T cell counts, and (F) hCD3+CD8+ T cell counts in whole brains, spinal cords, and spleens of recipient HuPBMC EAE mice at endpoint, grouped by PBMC donor EBV serostatus and RRMS diagnosis. Perfused organs were collected days 14 to 27 post–EAE induction (average 5 to 10 days post–symptom onset). For total immune cell quantification, n = 29 to 35 mice per group derived from two to three donors per group. For viral load quantification, n = 28 to 53 mice per group derived from two to four blood donors per group; n = 5 replicates for control EBV+ B95-8 cell line, and assay lower limit of detection is represented by a dashed line. All data are shown as means with SEM and were analyzed by Kruskal-Wallis with Dunn’s multiple comparisons test.
Fig. 5.
Fig. 5.. Donor EBV and RRMS status promote effector T cell expansion in the HuPBMC EAE model.
Figure shows whole brain and spinal cord infiltration and spleen reconstitution in recipient HuPBMC EAE mice at endpoint, grouped by PBMC donor EBV serostatus and RRMS diagnosis. (A) Concatenated flow cytometric plots of IFN-γ and IL-17A expression, showing the mean frequency of hCD3+CD4+ cells ± SD, as well as corresponding total (B) IFN-γ+(IL-17A), (C) IL-17A+(IFN-γ), and (D) IFN-γ+IL-17A+ hCD4+ T cell counts in each tissue. (E) Concatenated flow cytometric plots of IFN-γ and GzmB expression, showing the mean frequency of hCD3+CD8+ cells ± SD, quantified as (F) %IFN-γ+(GzmB), (G) %GzmB+(IFN-γ), and (H) %IFN-γ+GzmB+ of hCD3+CD8+ cells in each tissue. Perfused organs were collected days 14 to 27 post–EAE induction (average 5 to 10 days post–symptom onset). Isolated immune cells were stimulated with PMA and ionomycin for cytokine detection (n = 9 to 20 mice per group derived from one to two donors per group). All plotted data are shown as means with SEM and were analyzed by Brown-Forsythe and Welch ANOVA with Dunnett’s T3 multiple comparisons test or by Kruskal-Wallis with Dunn’s multiple comparisons test.
Fig. 6.
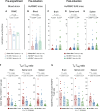
Fig. 6.. Donor EBV and RRMS status limit Treg expansion in HuPBMC EAE mice.
The proportion of hCD3+CD4+ T cells expressing FOXP3 in (A) freshly isolated donor PBMC (n = 3 to 4 donors per group), (B) in the peripheral blood of engrafted HuPBMC mice at 3 weeks post–PBMC injection (n = 57 to 62 mice per group derived from three to four donors per group), and in the (C) brain, (D) spinal cord, and (E) spleen of HuPBMC EAE mice at endpoint (n = 30 to 35 mice per group derived from two to three donors per group). The ratio of infiltrating (F) hCD4+IFN-γ+ (TH1) and (G) hCD8+IFN-γ+GzmB+ (Tc) to regulatory hCD4+FOXP3+ (Treg) cells per tissue in recipient HuPBMC EAE mice at endpoint, grouped by PBMC donor EBV serostatus and RRMS diagnosis (n = 7 to 20 mice per group from one to two donors per group). Cells were isolated from perfused organs collected days 14 to 27 post–EAE induction (average 5 to 10 days post–symptom onset) and, for cytokine detection, stimulated with PMA and ionomycin. Data are shown as means with SEM and were analyzed by Brown-Forsythe and Welch ANOVA with Dunnett’s T3 multiple comparisons test (A) or by Kruskal-Wallis with Dunn’s multiple comparisons test [(B) to (G)].
Fig. 7.
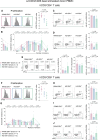
Fig. 7.. Donor T cell proliferation is enhanced by both EBV seropositivity and RRMS.
Previously frozen, whole PBMC samples from EBV+ RRMS, EBV+ HD, and EBV HD blood donors were incubated with anti-CD3/CD28–coated beads for 96 hours to stimulate T cells in the absence of a specific antigen. Figure shows (A) the proliferation index determined by CFSE staining, (B) the proportion of hCD4+ T cells having undergone a specified number of cellular divisions by CFSE staining, (C) Ki-67 expression, (D) Tumor necrosis factor–α (TNFα) expression, and (E) IFN-γ and IL-17A expression on hCD3+CD4+ T cells, as well as (F) the proliferation index determined by CFSE staining, (G) the proportion of hCD8+ T cells having undergone a specified number of cellular divisions by CFSE staining, (H) Ki-67 expression, (I) TNFα expression, and (J) IFN-γ expression on hCD3+CD8+ T cells. Concatenated flow plots indicate the sum proportion of marker positive cells for all donors in each group. The colored symbol legend is applicable to all comparisons (n = 3 to 4 blood donors per group). All plotted data are shown as means with SEM and were analyzed by Brown-Forsythe and Welch ANOVA with Dunnett’s T3 multiple comparisons test or by Kruskal-Wallis with Dunn’s multiple comparisons test.

References

    1. Dendrou C. A., Fugger L., Friese M. A., Immunopathology of multiple sclerosis. Nat. Rev. Immunol. 15, 545–558 (2015). - PubMed
    1. Klineova S., Lublin F. D., Clinical course of multiple sclerosis. Cold Spring Harb. Perspect. Med. 8, a028928 (2018). - PMC - PubMed
    1. Compston A., Coles A., Multiple sclerosis. Lancet 372, 1502–1517 (2008). - PubMed
    1. Rommer P. S., Ellenberger D., Hellwig K., Haas J., Pöhlau D., Stahmann A., Zettl U. K., Relapsing and progressive MS: The sex-specific perspective. Ther. Adv. Neurol. Disord. 13, 1756286420956495 (2020). - PMC - PubMed
    1. Olsson T., Barcellos L. F., Alfredsson L., Interactions between genetic, lifestyle and environmental risk factors for multiple sclerosis. Nat. Rev. Neurol. 13, 25–36 (2017). - PubMed

MeSH terms