. 2025 Apr 17;129(15):3537-3551.
doi: 10.1021/acs.jpca.4c08494. Epub 2025 Mar 5.

Two-Dimensional Electronic Spectroscopy of Rhodamine 700 Using an 8 fs Ultrabroadband Laser Source and Full-Wavelength Reference Detection

Affiliations

Two-Dimensional Electronic Spectroscopy of Rhodamine 700 Using an 8 fs Ultrabroadband Laser Source and Full-Wavelength Reference Detection

Camilla Gajo et al. J Phys Chem A. .

Abstract

Two-dimensional electronic spectroscopy (2DES) is one of the premier tools for investigating photoinduced condensed phase dynamics, combining high temporal and spectral resolution to probe ultrafast phenomena. We have coupled an ultrabroadband laser source generated with a hollow-core fiber, compressing pulses to have a pulse duration of 8 fs, with a boxcars 2DES interferometer constructed from only conventional optics. The resulting ultrabroad bandwidth and high temporal resolution allow for superior spectral coverage of the typically broad molecular line shapes in the near-IR/visible region in room temperature solutions, and the exploration of the excited state dynamics at the earliest time epoch in complex systems. The new spectrometer is characterized by examining the dynamics of the dye molecule Rhodamine 700 in methanol solution. These data exhibit rich vibrational wavepacket dynamics, with 2DES data unraveling key molecular vibronic couplings between multiple vibrational modes. For the first time in a degenerate broadband 2DES experiment, we demonstrate the implementation of full-wavelength reference detection to correct wavelength-dependent laser intensity fluctuations. The net result is a 4-5× increased signal-to-noise (S/N) ratio compared to data acquired without reference detection, yielding a typical S/N ratio = 28. The increased S/N ratio facilitates more rapid data acquisition and examination of samples at lower optical densities, and thus concentrations, than typically used in 2DES experiments. These advances will help to alleviate the typical high demands on precious samples in 2DES measurements.


Conflict of interest statement

The authors declare no competing financial interest.

Figures

Figure 1
Figure 1
Schematic optical layout of the 2DES interferometer. Laser beams in the spectrometer are vertically offset at BS2; however, in the diagram, this is illustrated as a horizontal offset to facilitate easier tracing of laser paths. The inset dashed box contains the 2DES laser pulse sequence and definition of pulses and interpulse time delays.
Figure 2
Figure 2
Characterization of laser pulse and 2DES spectrometer phase stability. (a) In situ TG-FROG pulse characterization of methanol in 200 μm path length flow cell at the sample position. (b) Integrated autocorrelation fit to a Gaussian function returning an 8 fs pulse duration and retrieved phase. (c) Interference fringes of the 2DES signal at t1 = 0 fs and t2 = 100 fs of a Rhod700 sample in methanol.
Figure 3
Figure 3
(a) Normalized steady-state absorption and fluorescence spectra of Rhodamine 700 in methanol solution. The laser spectrum at the sample position is also overlaid, with the dye’s chemical structure displayed inset. (b) Degenerate pump–probe data for waiting times between −100 and 800 fs. (c) Coherent wavepacket signals extracted from panel b. (d) Comparison of wavepacket dynamics at probe wavenumber 16,700 cm–1 for data acquired with (blue) and without (black) reference detection for 50 shots per t2 delay and 1 cycle, unreferenced data acquired with 500 shots (red). (e) Fourier transform along the t2 delay of data displayed in panel d highlights the signal-to-noise improvement achieved in pump–probe data by full-wavelength reference detection. For the purposes of comparison, the slices in panels d and e have been vertically offset.
Figure 4
Figure 4
(a) Fourier-transform map of the coherent time-domain wavepackets (Figure 3c) as a function of the probe wavenumber. Green, pink, and blue dashed lines correspond to steady-state absorption, fluorescence, and ESA maxima, respectively. Solid white lines correspond to nodes formed between antiphased oscillations. (b) Fourier transform slices for probe wavenumbers associated with the maxima of GSB (15,530 cm–1), SE (14,770 cm–1), and ESA (17,490 cm–1) transients. Note that the data are vertically offset. (c) Three calculated Franck–Condon active normal modes of Rhod700, with overlaid arrows indicating major nuclear displacements. Further details on the mode assignment are given in Table S2.
Figure 5
Figure 5
Raw 2DES(t13) interferograms for Rhod700 in methanol at t2 = 1000 fs (a) without and (b) with reference detection. Both 2D surfaces were acquired with 100 laser shots per t1 delay and only one spectral average. (c) Slices at ω3 = 14,925 cm–1 along t1–ω3 surfaces shown in panels a and b illustrate the improvement in the signal-to-noise ratio, σ (defined in the text) due to wavelength-dependent reference detection. (d) The probe-wavenumber dependent S/N ratio improvement factor determined from these data (gray line). A Gaussian smoothing function was applied to these data to reduce the inherent noise associated introduced from the unreferenced data (black line).
Figure 6
Figure 6
2DES spectra of Rhod700 at waiting times = (a) 104 fs, (b) 144, and (c) 1000 fs. All data were collected using wavelength-dependent reference detection. Data were acquired with 100 shots per t1 delay, and each 2DES surface was averaged for 3 cycles. Dashed lines on the probe axes correspond to the absorption and fluorescence maxima determined with steady-state spectroscopy.
Figure 7
Figure 7
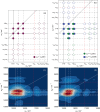
Theoretical beatmaps (rephasing pathways) for ω2 = (a) −ωa and (b) +ωa indicating the expected peak locations for vibronic transitions involving the fundamental mode, νa, and a coupled mode, νb, where the associated frequencies satisfy the ωa < ωb relation. The theoretical beatmaps were predicted using a combination of the double-sided Feynman diagrams illustrated in Figures S8–S11. Experimental rephasing coherence beatmaps for (c) −220 cm–1 and (d) +220 cm–1. The experimentally derived data are overlaid with solid white lines to indicate the S1–S0 0–0 transition energy (15,150 cm–1). Horizontal and vertical dashed white lines indicate the energies associated with one or two quanta of the fundamental mode, νa. Dashed red lines indicate the expected energies for the cluster of combination bands with a second vibrational mode νb.
Figure 8
Figure 8
Theoretical beatmaps (rephasing pathways only) for ω2 = (a) −ωa and (b) +ωa indicating the expected peak locations for vibronic transitions involving the fundamental frequency, ωa, and a coupled mode, ωb, where ωa > ωb. Beatmaps were predicted using double-sided Feynman diagrams shown in Figures S8–S11 and combinations thereof. Experimental rephasing coherence beatmaps for (c) −1240 cm–1, (d) +1240 cm–1, (e) −1360 cm–1, and (f) +1360 cm–1. Overlaid lines correspond to the same peak positions as detailed in the Figure 7 caption.
Figure 9
Figure 9
Comparison of +220 cm–1 rephasing beatmaps acquired for Rhod700 nm solutions with OD = 0.1 at 645 nm. Data shown in panel a was acquired with wavelength-dependent reference detection, whereas panel b did not correct for any fluctuations in the laser intensity. All data were acquired for the same number of shots and averages (100 shots per measurement, 3 averages per 2DES map).

References

    1. Ruetzel S.; Diekmann M.; Nuernberger P.; Walter C.; Engels B.; Brixner T. Multidimensional Spectroscopy of Photoreactivity. Proc. Natl. Acad. Sci. U.S.A. 2014, 111 (13), 4764–4769. 10.1073/pnas.1323792111. - DOI - PMC - PubMed
    1. Brixner T.; Mančal T.; Stiopkin I. V.; Fleming G. R. Phase-Stabilized Two-Dimensional Electronic Spectroscopy. J. Chem. Phys. 2004, 121 (9), 4221–4236. 10.1063/1.1776112. - DOI - PubMed
    1. Dean J. C.; Rafiq S.; Oblinsky D. G.; Cassette E.; Jumper C. C.; Scholes G. D. Broadband Transient Absorption and Two-Dimensional Electronic Spectroscopy of Methylene Blue. J. Phys. Chem. A 2015, 119 (34), 9098–9108. 10.1021/acs.jpca.5b06126. - DOI - PubMed
    1. Lee Y.; Das S.; Malamakal R. M.; Meloni S.; Chenoweth D. M.; Anna J. M. Ultrafast Solvation Dynamics and Vibrational Coherences of Halogenated Boron-Dipyrromethene Derivatives Revealed through Two-Dimensional Electronic Spectroscopy. J. Am. Chem. Soc. 2017, 139 (41), 14733–14742. 10.1021/jacs.7b08558. - DOI - PMC - PubMed
    1. Brixner T.; Stenger J.; Vaswani H. M.; Cho M.; Blankenship R. E.; Fleming G. R. Two-Dimensional Spectroscopy of Electronic Couplings in Photosynthesis. Nature 2005, 434 (7033), 625–628. 10.1038/nature03429. - DOI - PubMed

LinkOut - more resources