. 2025 Mar 6;16(1):2237.
doi: 10.1038/s41467-025-57136-7.

Virtual library docking for cannabinoid-1 receptor agonists with reduced side effects

Affiliations

Virtual library docking for cannabinoid-1 receptor agonists with reduced side effects

Tia A Tummino et al. Nat Commun. .

Abstract

Virtual library docking can reveal unexpected chemotypes that complement the structures of biological targets. Seeking agonists for the cannabinoid-1 receptor (CB1R), we dock 74 million tangible molecules and prioritize 46 high ranking ones for de novo synthesis and testing. Nine are active by radioligand competition, a 20% hit-rate. Structure-based optimization of one of the most potent of these (Ki = 0.7 µM) leads to '1350, a 0.95 nM ligand and a full CB1R agonist of Gi/o signaling. A cryo-EM structure of '1350 in complex with CB1R-Gi1 confirms its predicted docked pose. The lead agonist is strongly analgesic in male mice, with a 2-20-fold therapeutic window over hypolocomotion, sedation, and catalepsy and no observable conditioned place preference. These findings suggest that unique cannabinoid chemotypes may disentangle characteristic cannabinoid side-effects from analgesia, supporting the further development of cannabinoids as pain therapeutics.


Conflict of interest statement

Competing interests: B.K.S. is co-founder of BlueDolphin, LLC, Epiodyne, and Deep Apple Therapeutics, Inc., and serves on the SRB of Genentech, the SABs of Schrodinger LLC and of Vilya Therapeutics. J.J.I. is a co-founder of BlueDolphin LLC and of Deep Apple Therapeutics. Y.S.M. is a VP of Sales and Marketing at Enamine Ltd. and a scientific advisor at Chemspace LLC. D.S.R. is an employee of Enamine, Ltd. H.K., C.N., M.S., and L.S. are employees of Domain Therapeutics North America Inc. The authors declare no other competing interests.

Figures
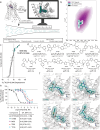
Fig. 1
Fig. 1. Docking of a 74-million molecule library against the CB1R.
a Workflow of the docking campaign. b Overlap of physical properties of CB1R ligands versus the top docked and purchased ligands. c Single-point radioligand displacement data for the 46 tested compounds. d 2D structures and properties of the nine hits. e Secondary binding assay for the top four hits. f Docked poses of the top four hits with H-bonds and other binding pocket residues indicated. Data in c & e represent mean ± SEM from three independent experiments in triplicate. Created in BioRender. Stevens, J. (2025). https://BioRender.com/b34k743.
Fig. 2
Fig. 2. Structure-activity relationships and optimization of ‘51486 to ‘1350 and ‘4936.
a Pharmacophore model based on the structure-activity relationships discovered via analoging ‘51486. b 2D structures and properties of the docking hit ‘51486 and most potent analogs. c Docking predicted pose of ‘51486 (teal) and ‘60154 (purple). d Docking predicted pose of ‘1350 (maroon) and ‘4936 (navy). e–g Binding affinity to rodent CB1R (rCB1) or functional cAMP inhibition to human CB1R (hCB1) by the ‘51486 analog series compared to CP-55,940. One-way ANOVA statistical significance of individual pKi (e; F (6, 13) = 152.2, P < 0.0001) or pEC50 (f; F (3, 19) = 154.9, P < 0.0001). Comparisons to CP-55,940 after correction with Dunnett’s test of multiple hypotheses are depicted in the table. pKi: CP-55,940 vs. ‘51486 and ‘60154: P < 0.0001; vs. ‘1350: P = 0.007; vs. ‘4936: P = 0.04. pEC50: CP-55,940 vs. ‘60154: P < 0.0001; vs. ‘1350: P = 0.0001; vs. ‘4936: P = 0.96. Data in e & f represent mean ± SEM from two or three independent experiments run in technical triplicate, respectively. ns = not significant, *P < 0.05, **P < 0.01, ****P < 0.001.
Fig. 3
Fig. 3. Cryo-EM structure of ‘1350-CB1R-Gi1 complex.
a Cryo-EM model of ‘1350-CB1R highlighting the ligand density. b Overlay of the docked pose (maroon) with the experimental pose (orange) of ‘1350.
Fig. 4
Fig. 4. In vivo analgesic profile of the cannabinoid agonists in acute thermal assays.
a Tail flick for CP-55,940 (n = 5 except baseline n = 10; one-way ANOVA, F(5, 29) = 10.9, P < 0.0001), and ‘1350 (n = 5 except baseline n = 10; one-way ANOVA, F(5, 29) = 48.1, P < 0.0001). Asterisks define individual group differences to respective vehicle control after Dunnett’s multiple comparisons post hoc test correction; ‘1350 vehicle vs. baseline: P > 0.99; vehicle vs. ‘1350, 0.05 mg/kg: P = 0.09; 0.1 mg/kg: P = 0.0005; 0.2 and 0.5 mg/kg: P < 0.0001; CP-55,940 vehicle vs. baseline: P = 0.80; vehicle vs. CP-55,940, 0.05 mg/kg: P = 0.91, 0.1 mg/kg: P > 0.99; 0.2 mg/kg: P = 0.32; 0.5 mg/kg: P = 0.0001. b Hot Plate for CP-55,940 (n = 5 except baseline n = 10; one-way ANOVA, F(2, 17) = 148.6, P < 0.0001), ‘1350 (n = 10 except 0.2 and 0.5 mg/kg n = 5; one-way ANOVA, F(4, 35) = 20.7, P < 0.0001), and ‘4936 (n = 10 except 0.05 mg/kg n = 5; one-way ANOVA, F(4, 40) = 6.5, P = 0.0004). Asterisks define individual group differences to baseline or vehicle after Dunnett’s multiple comparisons post-hoc correction; vehicle vs. ‘1350, 0.05 mg/kg: P = 0.85; 0.1 mg/kg: P = 0.006; 0.2 mg/kg: P = 0.0004; 0.5 mg/kg: P < 0.0001; baseline vs. CP-55,940, 0.2 mg.kg: P = 0.2; 0.5 mg.kg: P < 0.0001; vehicle vs. ‘4936, 0.05 mg/kg: P > 0.99, 0.1 mg/kg: P = 0.05, 0.2 mg/kg: P = 0.07; 0.5 mg/kg: P = 0.0002. Data in & b represent mean ± SEM. For all panels, n denotes number of independent animals per group. ns = not significant, *P < 0.05, **P < 0.01, ****P < 0.001.
Fig. 5
Fig. 5. Additional profiles of the cannabinoid agonists.
a Complete Freud’s Adjuvant (CFA) test (n = 10 except baseline and CFA n = 20; two-tailed unpaired t-tests, ‘1350 vs. vehicle: t(18) = 4.3, P = 0.0005; ‘1350 vs. baseline: t(28) = 2.4, P = 0.02; CFA vs. vehicle: t(28) = 0.6, P = 0.52; CFA vs. baseline: t(38) = 5.1, P < 0.0001; asterisks define t-test P value). b Acetone test (all n = 5; two-tailed unpaired t-tests, CP-55,940 vs. vehicle: t(8) = 9.3, P < 0.0001; ‘4936: t(8) = 2.4, P = 0.04; and ‘1350: one-way ANOVA, F(3, 16) = 14.25, P < 0.0001). For CP-55,940 and ‘4936, asterisks define t test P value. For ‘1350, asterisks define differences after Dunnett’s multiple comparisons correction; vehicle vs. ‘1350, 0.05 mg/kg: P = 0.0084; 0.1 mg/kg: P = 0.0002; 0.2 mg/kg: P < 0.0001. c Formalin test (all n = 5; multiple two-tailed unpaired t-tests with Holm-Šídák correction; vehicle vs. ‘1350, 5 min: P < 0.0001; 10 and 20 min: P = 0.03; 15 min: P = 0.003; 25, 30, and 35 min: P = 0.005; 40 min: P = 0.001; 45 and 50 min: P < 0.0001; 55 min: P = 0.005; 60 min: P = 0.002. d Tail flick in wildtype (WT) versus CB1R knockout (KO) mice (WT: CP-55,940 and morphine n = 5, ‘1350 n = 10, baseline n = 15; CB1R KO: CP-55,940, morphine, and ‘1350 n = 5, baseline n = 10; two-way ANOVA; genotype x drug interaction: F(4, 60) = 6.7, P = 0.002; genotype: F(1, 60) = 10.8, P = 0.002; drug: F(4, 60) = 45.5, P < 0.0001). Asterisks define differences after Šídák’s multiple comparisons correction; WT: baseline vs. CP-55,940: P = 0.78; baseline vs. ‘1350 and morphine: P < 0.0001; CB1R KO: baseline vs. CP-55,940: P > 0.99; vs. ‘1350: P = 0.99; vs. morphine: P < 0.0001. ad represent mean ± SEM; n denotes the number of independent animals per group. ns, not significant, *P < 0.05, **P < 0.01, ***P < 0.001, ****P < 0.0001.
Fig. 6
Fig. 6. Improved therapeutic window effects of ‘1350 and ‘4936.
a Open Field test (n = 5 except vehicle n = 10; one-way ANOVAs, ‘1350: F(2, 17) = 9.5, P = 0.002; CP-55,940: F(2, 17) = 13.7, P = 0.003). Asterisks define differences after Dunnett’s multiple comparisons post-hoc correction; vehicle vs. ‘1350, 0.2 mg/kg: P = 0.03; 0.5 mg/kg: P = 0.001; vs. CP-55,940, 0.2 mg/kg: P = 0.0006; 0.5 mg/kg: P = 0.002. b Rotarod test (n = 5 for CP-55,940 0.1, 1.0 mg/kg, ‘1350 0.1, 0.5 mg/kg, ‘4936 0.2, 2.0 mg/kg. n = 10 for CP-55,940 vehicle, 0.2 mg/kg, ‘1350 vehicle, 0.2 mg/kg, and ‘4936 vehicle, 0.5, 1.0 mg/kg; one-way ANOVAs, CP-55,940: F(3, 26) = 5.7, P = 0.04; ‘1350: F(3, 26) = 5.7, P = 0.004; ‘4936: F(4, 35) = 2.7, P = 0.05). Asterisks define differences after Dunnett’s multiple comparisons post-hoc correction; vehicle vs. CP-55,940, 0.1 mg/kg: P = 0.42; 0.2 mg/kg: P = 0.02; 1.0 mg/kg: P = 0.006; vehicle vs. ‘1350, 0.1 mg/kg: P = 0.99; 0.2 mg/kg: P = 0.32; 0.5 mg/kg: P = 0.002; vehicle vs. ‘4936, 0.2 mg/kg: P = 0.99; 0.5 mg/kg: P = 0.71; 1.0 mg/kg: P = 0.4; 2.0 mg/kg: P = 0.02. c Catalepsy test (n = 5 for haloperidol vehicle, 1.0 mg/kg, CP-55,940 0.2, 1.0 mg/kg, ‘1350 vehicle, 0.2, 1.0 mg/kg, and ‘4936 vehicle, 0.2, 0.5, 1.0 mg/kg. n = 10 for haloperidol baseline, CP-55,940 vehicle, 0.5 mg/kg. n = 15 for ‘1350 0.5 mg/kg. n = 20 for haloperidol, CP-55,940 baseline. n = 30 for ‘1350 baseline; one-way ANOVAs, CP-55,940: F(3, 26) = 10.7, P < 0.0001; ‘1350: F(3, 26) = 1.03, P = 0.4; ‘4936: F(4, 29) = 1.04, P = 0.4; two-tailed unpaired t-test, haloperidol: t(8) = 6.2, P = 0.0002). Asterisks define differences between 1 mg/kg compound dose to vehicle after t-test (haloperidol) or Dunnett’s multiple comparisons post-hoc correction; ‘1350: P = 0.29; CP-55,940: P < 0.0001; ‘4936: P = 0.67. d–f Therapeutic windows. ac represent mean ± SEM; n denotes number of independent animals per group. ns, not significant, *P < 0.05, **P < 0.01, ***P < 0.001, ****P < 0.0001.
Fig. 7
Fig. 7. Additional side effect and cotreatment profile of ‘1350.
a Body temperatures after treatment with CP-55,940 (n = 5; one-way ANOVA, F(10, 44) = 13.3, P < 0.0001) and ‘1350 (n = 3; one-way ANOVA, F(10, 22) = 27.3, P < 0.0001). Asterisks define differences between each group 90 min. post-dose to vehicle; ‘1350 0.2 mg/kg: P < 0.0001; CP-55,940 0.2 mg/kg: P = 0.0005. b Tail flick cotreatment of morphine with ‘1350 (morphine alone and baseline n = 15, ‘1350 plus morphine n = 10, vehicle n = 5, one-way ANOVA, F(4, 50) = 14.7, P < 0.0001). Asterisks define cotreatment differences to morphine (3 mg/kg) after Dunnett’s multiple comparisons post-hoc correction; ‘1350 0.05 mg/kg: P = 0.029; 0.1 mg/kg: P < 0.0001. All data represent mean ± SEM; n denotes number of independent animals per group. ns, not significant, *P < 0.05, **P < 0.01, ***P < 0.001, ****P < 0.0001.

Update of

References

    1. Lipman, A. G. Medical cannabis for pain: anecdote or evidence. J. Pain. Palliat. Care Pharmacother.31, 96–97 (2017). - PubMed
    1. Iliopoulos-Tsoutsouvas, C., Georgiadis, M.-O., Ji, L., Nikas, S. P. & Makriyannis, A. Natural Compounds and Synthetic Drugs to Target Type-1 Cannabinoid (CB1) Receptor. in New Tools to Interrogate Endocannabinoid Signalling: From Natural Compounds to Synthetic Drugs (ed. Maccarrone, M.) 48–88 (The Royal Society of Chemistry). 10.1039/9781839160752-00048 (2020).
    1. Sachs, J., McGlade, E. & Yurgelun-Todd, D. Safety and toxicology of cannabinoids. Neurotherapeutics12, 735–746 (2015). - PMC - PubMed
    1. Cohen, K., Weizman, A. & Weinstein, A. Positive and negative effects of cannabis and cannabinoids on health. Clin. Pharmacol. Ther.105, 1139–1147 (2019). - PubMed
    1. Donvito, G. et al. The Endogenous Cannabinoid System: A Budding Source of Targets for Treating Inflammatory and Neuropathic Pain. Neuropsychopharmacol43, 52–79 (2018). - PMC - PubMed