. 2025 Mar 5;16(1):2158.
doi: 10.1038/s41467-025-56479-5.

Analysis of human urinary extracellular vesicles reveals disordered renal metabolism in myotonic dystrophy type 1

Affiliations

Analysis of human urinary extracellular vesicles reveals disordered renal metabolism in myotonic dystrophy type 1

Preeti Kumari et al. Nat Commun. .

Abstract

Chronic kidney disease (CKD) and the genetic disorder myotonic dystrophy type 1 (DM1) each are associated with progressive muscle wasting, whole-body insulin resistance, and impaired systemic metabolism. However, CKD is undocumented in DM1 and the molecular pathogenesis driving DM1 is unknown to involve the kidney. Here we use urinary extracellular vesicles (EVs), RNA sequencing, droplet digital PCR, and predictive modeling to identify downregulation of metabolism transcripts Phosphoenolpyruvate carboxykinase-1, 4-Hydroxyphenylpyruvate dioxygenase, Dihydropyrimidinase, Glutathione S-transferase alpha-1, Aminoacylase-1, and Electron transfer flavoprotein B in DM1. Expression of these genes localizes to the kidney, especially the proximal tubule, and correlates with muscle strength and function. In DM1 autopsy kidney tissue, characteristic ribonuclear inclusions are evident throughout the nephron. We show that urinary organic acids and acylglycines are elevated in DM1, and correspond to enzyme deficits of downregulated genes. Our study identifies a previously unrecognized site of DM1 molecular pathogenesis and highlights the potential of urinary EVs as biomarkers of renal and metabolic disturbance in these individuals.


Conflict of interest statement

Competing interests: M.G.H. and T.M.W. have been awarded a patent (U.S. patent number 11,866,782 B2; International patent application number PCT/2017/043348) for the use of extracellular RNA to identify markers of muscular dystrophies. The remaining authors declare no competing interests.

Figures

Fig. 1
Fig. 1. Study overview and RNA sequencing analysis.
a Study overview. EV extracellular vesicle, ddPCR droplet digital polymerase chain reaction. Created in BioRender (Kumari; https://BioRender.com/s97f089). b Urine exRNA sequencing analysis in DM1 and DMD. Volcano plot of log2 of the fold change (DM1 vs DMD) following edgeR analysis. Using a P value < 0.05, downregulated transcripts are highlighted in blue and upregulated transcripts are shown in orange. c Principal component analysis of differentially expressed transcripts using a log2 fold change >1.0 or < −1.0 and a P value < 0.05. d Gene Set Enrichment Analysis (GSEA) using the Molecular Signatures Database and the Gene Ontology Biologic Process gene sets comparing DM1 and DMD exRNA samples. The top 10 categories of downregulated (blue) and upregulated (orange) genes in DM1 by false discovery rate (FDR) Q value are shown. e Transcripts per million (TPM) values in DM1 and DMD (N = 3 each) for individual differentially expressed genes. ***P = 0.0003 (PCK1), 0.0008 (DPYS), and 0.0002 (KRT20); **P = 0.0096 (GCDH), 0.0039 (HSD17B14), and 0.0089 (BIN1); *P = 0.0219 (two-tailed t tests). Error bars indicate ± s.e.m. Source data are provided as a Source Data file.
Fig. 2
Fig. 2. ddPCR quantification of gene expression in EVs.
a We used ddPCR to quantify expression of PCK1, HPD, DPYS, GSTA1, ACY1, ETFB, GCDH, HSD17B14, PIGT, BIN1, KRT20, and HPGD normalized to FAM168A in urinary EVs of DM1 (N = 39–47), DM2 (N = 10–13), DMD (N = 8–12), and UA controls (N = 27–39). ****P < 0.0001; ***P < 0.001; **P < 0.01; *P < 0.05 (one-way ANOVA/Tukey). b ddPCR quantification of PCK1, HPD, DPYS, GSTA1, ACY1, PIGT, BIN1, and HPGD expression normalized to FAM168A in serum EVs of DM1 (N = 4–8) and UA controls (N = 3–7). Error bars indicate ±s.e.m. Source data are provided as a Source Data file.
Fig. 3
Fig. 3. ddPCR quantification of gene expression in tissues and localization within the nephron.
a ddPCR quantification of PCK1, HPD, DPYS, GSTA1, ACY1, and ETFB normalized to reference gene FAM168A in human DM1 autopsy kidney tissue from individuals ages 50–55 with advanced DM1 (Muscle Impairment Rating Scale score of 4 [MIRS 4]; N = 3) and age 80 with minimal DM1 (MIRS 3, including normal strength of ankle dorsiflexion; N = 1) and a CTG repeat expansion <100. Commercially available total RNA of human kidney served as a control. Error bars indicate ± s.e.m. b Renal tubule localization of Pck1 (black circles), Hpd (yellow squares), Dpys (purple triangles), Gsta1 (turquoise inverted triangles), Acy1 (orange diamonds), and Etfb (blue hexagons) expression by RNA sequencing of microdissected rat nephrons (Kidney Tubule Expression Atlas). TPM transcripts per million, Prox. tubule proximal tubule, DCT distal convoluted tubule, Coll. duct collecting duct. Source data are provided as a Source Data file.
Fig. 4
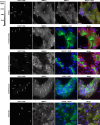
Fig. 4. Localization of CUGexp RNA within the nephron.
We performed fluorescence in situ hybridization for CUGexp RNA and immunofluorescence labeling for MBNL2 together with MBNL1, megalin (renal proximal tubule), sodium-potassium-chloride cotransporter 2 (NKCC2; loop of Henle), aquaporin 2 (AQP2; collecting duct), or podocalyxin (PODXL; podocytes) proteins in DM1 autopsy kidney specimens (N = 4). The arrows indicate co-localization of CUGexp RNA and MBNL2 protein with MBNL1 protein (upper row) and CUGexp RNA and MBNL2 protein within the indicated regions of the nephron (lower four rows). In the merge images, yellow indicates CUGexp RNA, red indicates MBNL2 protein, blue indicates nuclei, and green indicates MBNL1, megalin, NKCC2, AQP2, or PODXL. Bars = 10 µm.
Fig. 5
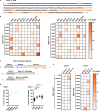
Fig. 5. ddPCR correlations, principal component analysis (PCA), and predictive modeling.
a ddPCR expression correlation matrix of 12 DEGs in urinary EVs (see Fig. 2). The Pearson correlation coefficient r for each comparison is shown within the matrix. The scale shows the log10 of the P values for each correlation within the matrix (two-tailed t tests). b Principal component analysis of ddPCR gene expression in urinary EVs of DM1 (N = 24) and UA (N = 25) using four proximal tubule genes PCK1, HPD, DPYS, and GSTA1 (upper) and eight genes comprised of the four proximal tubule genes along with PIGT, BIN1, KRT20, and HPGD (lower). The first two principal components PC1 and PC2 are shown. c Percent contribution of each of the eight genes to the separation of DM1 and UA along PC1 (blue) and PC2 (orange). d We combined 8-transcript PC data from the first 49 participants (N = 24 DM1; 25 UA), then randomly assigned 76% (N = 37), irrespective of genotype, to a training set, and the remaining 24% (N = 12) to an independent validation set. Using the training set and a threshold of 0.5 (see “Methods”), we developed a predictive model that was 97.5% accurate in a fivefold cross-validation test. The receiver operating characteristic (ROC) curve is shown. e Confusion matrix for the held-out test set (N = 12) and the next 22 individuals enrolled after model implementation (N = 34 total). The model correctly predicted 16/19 DM1 and all 15 UA volunteers (31/34 = 91%). Source data are provided as a Source Data file.
Fig. 6
Fig. 6. Mechanism of reduced gene expression in DM1 urine exRNA.
a Nucleotide sequence of human PCK1 3′ UTR beginning with the stop codon TAA (red). Recognition motifs GTGT/TGTG for the RNA-binding protein CELF1 are highlighted in orange. b We used a chi-square test to estimate the enrichment of recognition motifs for RNA-binding proteins CELF1 (left) and MBNL (right) in the 3′ untranslated region (UTR) of downregulated transcripts PCK1, HPD, DPYS, GSTA1, ACY1, ETFB, GCDH, HSD17B14, PIGT, and BIN1 (see “Methods”). The scale indicates the chi-square value for each recognition motif shown in the matrix, except # indicates chi-square = 51. c CELF1 sequence showing the 12-nucleotide alternatively spliced portion of exon 10 (yellow). The MBNL recognition motif CAGC is underlined. d ddPCR quantification of CELF1 full-length exon 10 in human control tissues (left) and in urinary EVs of DM1, DM2, DMD (N = 11), and UA participants. Error bars indicate ± s.e.m. ****P < 0.0001; *P < 0.05 (one-way ANOVA/Tukey). e Chi-square test for RNA recognition motifs of RNA-binding proteins CELF1 and MBNL in intron 9, exon 10, and intron 10 sequence of the CELF1 transcript (see Methods). Source data are provided as a Source Data file.
Fig. 7
Fig. 7. Elevated urine organic acids and acylglycines in DM1.
a Elevated urine organic acids in DM1 (N = 20 individuals) include TCA cycle intermediates, C6-C10 dicarboxylic acids, and tyrosine catabolism intermediates (mmol metabolite/mol creatinine; Quest Diagnostics). b Elevated acylglycines and fatty acid oxidation intermediates in DM1 (N = 16 individuals) (mg metabolite/g creatinine; Mayo Clinic Laboratories). The blue-shaded areas indicate the reference range for each metabolite. Error bars indicate ± s.e.m. See Supplementary Fig. 13. Source data are provided as a Source Data file.
Fig. 8
Fig. 8. Correlation of urinary EV gene expression with functional measures.
Correlation of ddPCR expression of the genes PCK1, HPD, DPYS, GSTA1, ACY1, ETFB, and GCDH in urine exRNA of DM1 participants (N = 33) with clinical measurements of (a) 6-min walk test (6MWT) % predicted, b ankle dorsiflexion (ADF) strength-to-weight ratio (N = 33 left side + 33 right side = 66 total measures), and (c) handgrip (HG) strength-to-weight ratio (N = 66 total measures). The correlation coefficient and P value for each are shown (two-tailed t tests). d Correlation of ddPCR expression of the genes PCK1, HPD, DPYS in urinary EVs with peak expiratory flow rate (PEFR) % predicted in DM1 participants (N = 33). The correlation coefficient r and P values for each are shown (two-tailed t tests). e Correlation of ddPCR expression of HPD and DPYS in urinary EVs with maximal inspiratory pressure % predicted in DM1 participants (N = 33). The correlation coefficient r and P values for each are shown (two-tailed t tests). See Supplementary Fig. 14. Source data are provided as a Source Data file.
Fig. 9
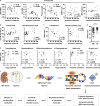
Fig. 9. Correlation of urinary metabolites with functional measures.
a Correlation of urinary 5-Oxoproline levels with ankle dorsiflexion (ADF) strength-to-weight ratio (SWR), handgrip SWR, pinch (thumb and index finger) strength (pounds of force), scale for the assessment and rating of ataxia (SARA) score, and the electrocardiogram measurement QRS duration in DM1 individuals (N = 20; for strength measures, N = 20 left side and N = 20 right side for a total of 40 separate measures). b Correlation of urinary 5-oxoproline and 4-OH-phenylacetic acid levels with the time to complete the 9-hole peg test (s) in DM1 individuals (N = 20 right hand and N = 20 left hand, for a total of 40 separate measures). c Correlation of urinary 5-oxoproline and 4-OH-phenylacetic acid levels with the Fatigue and Daytime Sleepiness (FDSS) score in DM1 (N = 20). The correlation coefficient r and P values for each are shown (two-tailed t tests). d University of Pennsylvania Smell Identification (UPSIT) scores of DM1 (N = 40) and UA (N = 43) participants (maximum score = 40). ****P < 0.0001 (two-tailed t test). Error bars indicate ± s.e.m. e Relationship of urine N-acetylglycine, isobutyrylglycine, 2-methylbutyrylglycine, N-octanoylglycine, adipic acid, and aconitic acid to UPSIT score in DM1 participants (N = 14–19). The correlation coefficient r and P values for each are shown (two-tailed t tests). f Working model of DM1 molecular pathogenesis within the nephron leading to downregulation of metabolism genes and elevation of corresponding metabolites. The kidney and nephron diagrams were created in Biorender (Kumari; https://BioRender.com/t33c158). Source data are provided as a Source Data file.

References

    1. Turner, C. & Hilton-Jones, D. Myotonic dystrophy: diagnosis, management and new therapies. Curr. Opin. Neurol.27, 599–606 (2014). - PubMed
    1. Krentz, A. J., Williams, A. C. & Nattrass, M. Insulin resistance in multiple aspects of intermediary metabolism in myotonic dystrophy. Metabolism40, 866–872 (1991). - PubMed
    1. Ashizawa, T. et al. Consensus-based care recommendations for adults with myotonic dystrophy type 1. Neurol. Clin. Pr.8, 507–520 (2018). - PMC - PubMed
    1. Brook, J. D. et al. Molecular basis of myotonic dystrophy: expansion of a trinucleotide (CTG) repeat at the 3’ end of a transcript encoding a protein kinase family member. Cell68, 799–808 (1992). - PubMed
    1. Overend, G. et al. Allele length of the DMPK CTG repeat is a predictor of progressive myotonic dystrophy type 1 phenotypes. Hum. Mol. Genet.28, 2245–2254 (2019). - PMC - PubMed

LinkOut - more resources