. 2025 Mar 6;16(1):2235.
doi: 10.1038/s41467-025-57556-5.

Structure-function relationship of ASH1L and histone H3K36 and H3K4 methylation

Affiliations

Structure-function relationship of ASH1L and histone H3K36 and H3K4 methylation

Kendra R Vann et al. Nat Commun. .

Abstract

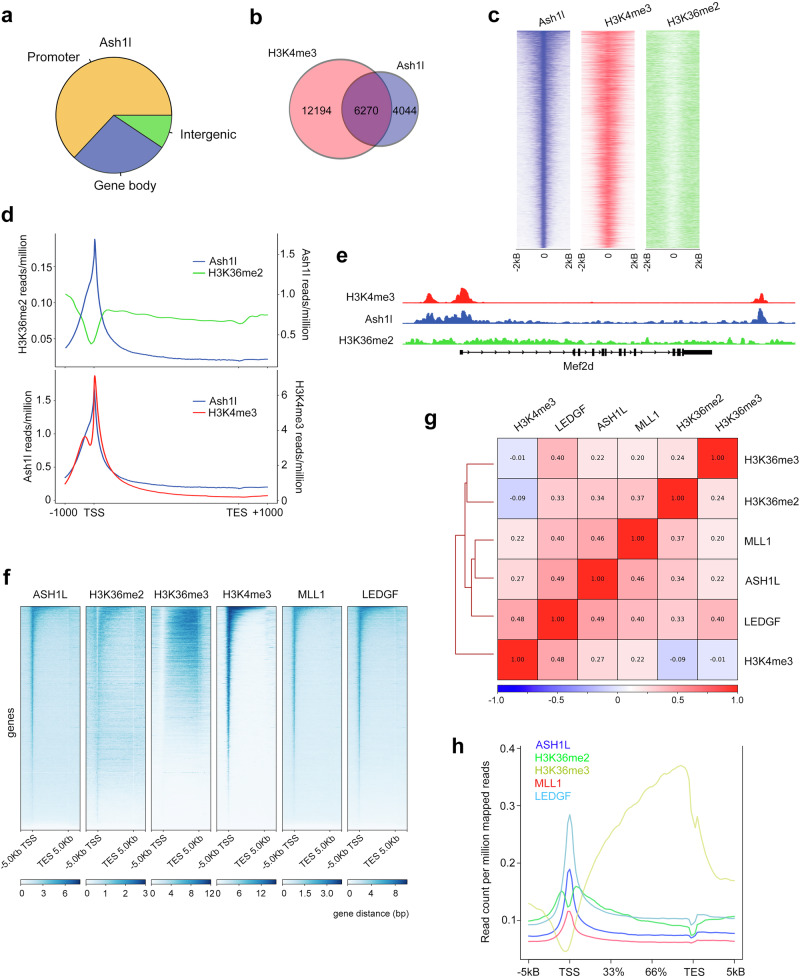
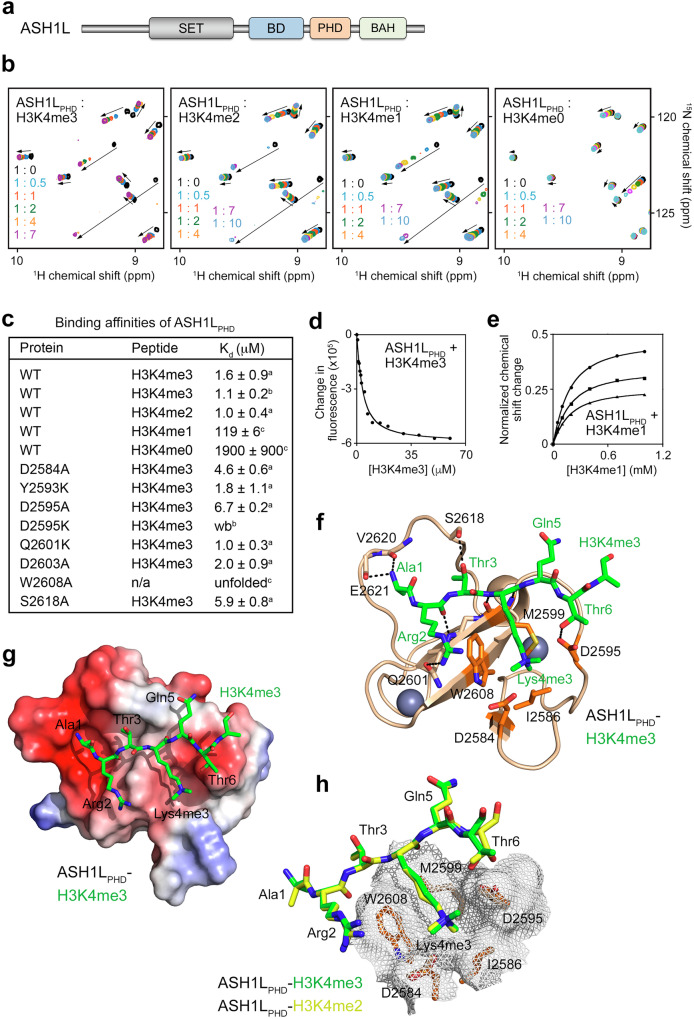
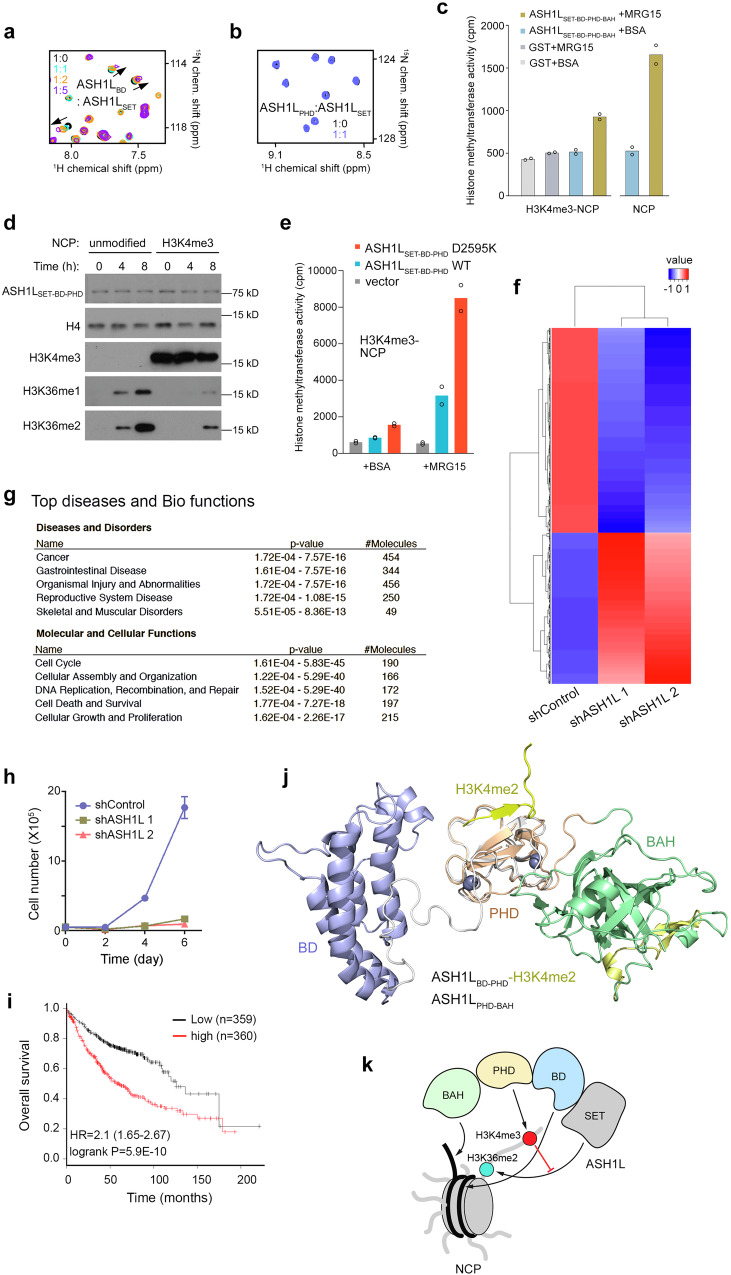
The histone H3K36-specific methyltransferase ASH1L plays a critical role in development and is frequently dysregulated in human diseases, particularly cancer. Here, we report on the biological functions of the C-terminal region of ASH1L encompassing a bromodomain (ASH1LBD), a plant homeodomain (ASH1LPHD) finger, and a bromo-adjacent homology (ASH1LBAH) domain, structurally characterize these domains, describe their mechanisms of action, and explore functional crosstalk between them. We find that ASH1LPHD recognizes H3K4me2/3, whereas the neighboring ASH1LBD and ASH1LBAH have DNA binding activities. The DNA binding function of ASH1LBAH is a driving force for the association of ASH1L with the linker DNA in the nucleosome, and the large interface with ASH1LPHD stabilizes the ASH1LBAH fold, merging two domains into a single module. We show that ASH1L is involved in embryonic stem cell differentiation and co-localizes with H3K4me3 but not with H3K36me2 at transcription start sites of target genes and genome wide, and that the interaction of ASH1LPHD with H3K4me3 is inhibitory to the H3K36me2-specific catalytic activity of ASH1L. Our findings shed light on the mechanistic details by which the C-terminal domains of ASH1L associate with chromatin and regulate the enzymatic function of ASH1L.


Conflict of interest statement

Competing interests: The authors declare no competing interests.

Figures

Fig. 1
Fig. 1. Ash1L is essential for mouse ES cell differentiation.
a Heatmap of RNA-seq data from showing relative expression levels of selected families of genes in ES cells differentiated under various conditions, as indicated. Expression values are normalized to each gene. b Expression levels of Ash1l in ES cells upon differentiation under various conditions as in a. Values are plotted in Fragments per Kilobase of Exon per Megabase (FPKM). c, d qPCR analysis of transcriptional expression of Ash1l in mouse ES cells following differentiation as embryoid bodies (EBs) (c) or by retinoic acid (d) in a time course, as indicated. Error bars represent mean from three replicates ± SEM. e Relative expression levels of target differentiation markers in wildtype and ΔAsh1l CRISPR edited (B7 clone) mES cells 2 days post retinoic acid induced differentiation, as measured by qPCR. Error bars represent mean from three replicates ± SEM. f Relative expression of target differentiation genes during embryoid body development in WT or ΔAsh1l mES cells transfected with shLuc or shAsh1l, respectively. Error bars represent mean from three replicates ± SEM. g Ash1l occupancy at the Meis2 enhancer and promoter sites in mES cells pre- and post-RA-induced differentiation, as shown by ChIP-qPCR analysis. * denotes p < 0.001 using an unpaired t test (two-sided). Error bars represent mean from three replicates ± SEM. Source data are provided with this paper.
Fig. 2
Fig. 2. ASH1L regulates gene expression and co-localizes with H3K4me3.
a Genomic distribution of Ash1l peaks in differentiated mouse ES cells as assessed by ChIP-seq. b Venn diagram showing co-occupancy of Ash1l and H3K4me3 peaks in mouse ES cells, as determined by ChIP-seq. c Heatmaps of Ash1l, H3K4me3, and H3K36me2 occupancy across Ash1l peaks in mouse ES cells, aligned to decreasing intensity of Ash1l peaks. d Plots of H3K36me2 and H3K4me3 occupancy at Ash1l target genes in mouse ES cells. e Ash1l, H3K4me3, and H3K36me2 occupancies at the Mef2d locus observed in the ChIP-seq data from mouse ES cells. f Peak-centered analysis showing ChIP-seq density heat maps of whole gene region occupancies (starting 5 kb upstream of TSS and ending 5 kb downstream of TES) for the indicated proteins and histone marks in human MV4-11 cells. g Pearson correlation of overlapping distribution profiles for the indicated proteins and histone marks in MV4-11 cells. h Occupancy of the indicated proteins and PTMs at ASH1L target genes in MV4-11 cells.
Fig. 3
Fig. 3. ASH1LPHD is a reader of H3K4me3.
a Schematic of ASH1L domain organization. b Overlays of 1H,15N HSQC spectra of ASH1LPHD collected in the absence (black) and presence of the indicated molar ratios of histone H3K4me3, H3K4me2, H3K4me1 or H3K4me0 (all aa 1-12 of H3) peptides. c Binding affinities of wildtype and mutated ASH1LPHD for indicated histone H3 peptides, as measured by tryptophan fluorescencea, MSTb or NMRc. d Representative binding curve used to determine Kd values by tryptophan fluorescence. Kds are calculated as mean values +/- S.D. from three independent experiments. e Representative binding curves used to determine Kd values by NMR. 1H/15N Normalization equation is shown in NMR methods. Kds are represented as mean values +/- S.D. The experiment was performed once. f A ribbon diagram of the crystal structure of ASH1LPHD (wheat) in complex with H3K4me3 peptide (green sticks). Zinc ions are shown as gray spheres and hydrogen bonds are shown as dashed lines. The trimethylammonium binding cage residues of ASH11LPHD are shown as sticks and colored orange. g Electrostatic surface potential of the ASH1LPHD bound to H3K4me3 peptide (green sticks). Electrostatic potential ranging from positive;blue (+100 kT/e) to negative;red (−100 kT/e) generated with PyMol vacuum electrostatics. h Overlay of the crystal structures of the H3K4me3-bound and H3K4me2-bound ASH11LPHD (also see Supplementary Fig. 5). The methyllysine binding cage surface is represented in mesh. The H3K4me3 and H3K4me2 peptides are green and yellow, respectively.
Fig. 4
Fig. 4. DNA and histone binding activities of ASH1LBD.
a Ribbon diagram of the NMR solution structure of ASH1LBD-PHD (BD, blue and PHD, wheat) in complex with H3K4me2 peptide (yellow). b Electrostatic surface potential of ASH1LBD-PHD bound to H3K4me2 peptide (yellow). Unstructured linker region between the domains is shown as gray loop. Electrostatic potential ranging from positive;blue (+100 kT/e) to negative;red (−100 kT/e) generated with PyMol vacuum electrostatics. c Overlay of the NMR solution structure of ASH1LBD-PHD (BD, blue and PHD, wheat) bound to H3K4me2 peptide (yellow) with the crystal structure of ASH1LPHD (gray) bound to H3K4me2 peptide (gray). d Overlay of 1H,15N HSQC spectra of ASH1LBD in the absence (black) or presence (orange) of H3K56ac peptide. eg EMSA with 147-bp 601 DNA in the presence of increasing amounts of ASH1LBD, WT and the indicated mutants. Source data are provided with this paper.
Fig. 5
Fig. 5. ASH1LBAH fuses with ASH1LPHD and binds DNA.
a Overlay of 1H,15N TROSY spectra of ASH1LPHD-BAH (black) and ASH1LPHD (red). b A ribbon diagram of the crystal structure of ASH1LPHD-BAH (PHD, wheat; BAH, green; and a β-hairpin insertion, yellow). Zinc ions are shown as gray spheres, and dashed lines indicate hydrogen bonds. c A zoom-in view of the PHD-BAH interface. Dashed lines indicate hydrogen bonds, and the interacting residues (sticks) are labeled. d Overlay of crystal structures of ASH1LPHD-BAH (PHD, wheat; BAH, green; and a β-hairpin insertion, yellow) and ASH1LPHD (gray) bound to H3K4me3 peptide (green). e Electrostatic surface potential of ASH1LPHD-BAH. Histone H3K4me3 (green sticks) positioned based on overlay in d. Electrostatic potential ranging from positive;blue (+100 kT/e) to negative;red (−100 kT/e) generated with PyMol vacuum electrostatics. f Representative binding curves used to determine Kd values of ASH1LPHD-BAH for H3K4me3 peptide by tryptophan fluorescence. Kd was calculated as a mean value +/- S.D. from three independent experiments. g, h EMSA with 147 bp 601 DNA (g) or 147 bp H3K4me3-NCP (h) in the presence of increasing amounts of ASH1LPHD-BAH. Source data are provided with this paper.
Fig. 6
Fig. 6. Binding of ASH1LPHD to H3K4me3 inhibits enzymatic activity of ASH1L.
a Overlay of 1H,15N HSQC spectra of ASH1LBD in the absence (black) or presence of the indicated molar ratios of ASH1LSET. b Overlay of 1H,15N HSQC spectra of ASH1LPHD in the absence (black) or presence (blue) of ASH1LSET. c Liquid histone methyltransferase (HMT) assays of GST-ASH1LSET-BD-PHD-BAH on recombinant nucleosomes carrying H3K4me3 or unmodified NCP. GST-ASH1LSET-BD-PHD-BAH was pre-incubated with substrate and MRG15 (or BSA) prior addition of 3H S-adenosyl methionine. GST, control. Experiment shown was performed in duplicate and was repeated at least three times with different preps of recombinant GST-ASH1LSET-BD-PHD-BAH with similar results. d Western blot analysis of in vitro KMT assays of recombinant GST-ASH1LSET-BD-PHD on unmodified and H3K4me3-nucleosomes. e Liquid HMT assays of recombinant GST-ASH1LSET-BD-PHD on H3K4me3-nucleosomes in the absence (BSA) or presence of MRG15. Experiment shown was performed in duplicate and was repeated at least three times with different preps of recombinant proteins with similar results. f Heatmap of gene expression profiles in human lung adenocarcinoma A549 cells transfected with control (shNT) or shASH1L. Blue and red colors indicate down and up regulation of genes, respectively. g IPA analysis of the downregulated 541 genes in ASH1L knockdown cells. The top five hits of each category are listed. Statistical test used was one-sided. h Cell proliferation assays of the control (shControl) and ASH1L knockdown A549 cells. Live cells were counted over a 6-day time course. Error bars represent mean from three replicates ± SEM. i Kaplan-Meier analysis of human lung adenocarcinoma patients with low or high ASH1L gene expression levels. j Overlay of the structures of the H3K4me2-bound ASH1LBD-PHD and ASH1LPHD-BAH. k A model of the functional cooperation between ASH1L domains in the context of the nucleosome. DNA and histone tails are shown as black and gray curves, respectively. Histone H3 modifications are indicated by colored circles and labeled. Source data are provided with this paper.

References

    1. Qin, L. et al. Deficiency of autism risk factor ASH1L in prefrontal cortex induces epigenetic aberrations and seizures. Nat. Commun.12, 6589 (2021). - PMC - PubMed
    1. Castiglioni, I. et al. The Trithorax protein Ash1L promotes myoblast fusion by activating Cdon expression. Nat. Commun.9, 5026 (2018). - PMC - PubMed
    1. Xia, M. et al. Ash1l and lnc-Smad3 coordinate Smad3 locus accessibility to modulate iTreg polarization and T cell autoimmunity. Nat. Commun.8, 15818 (2017). - PMC - PubMed
    1. Zhu, L. et al. ASH1L Links Histone H3 Lysine 36 Dimethylation to MLL Leukemia. Cancer Discov.6, 770–783 (2016). - PMC - PubMed
    1. Miyazaki, H. et al. Ash1l methylates Lys36 of histone H3 independently of transcriptional elongation to counteract polycomb silencing. PLoS Genet9, e1003897 (2013). - PMC - PubMed

MeSH terms

LinkOut - more resources